6.2 - Environmental impacts on RGR
Light, CO2, temperature, water and nutrients are key driving variables or limiting factors for growth responses in a wide range of species. Growth indices serve as an indicator of plant response, and of interactions between environmental factors where they occur. Variation in whole-plant RGR can be resolved into contributions from NAR (net assimilation rate) and LAR (ratio of leaf area to total plant mass). LAR in turn can be separated into SLA (ratio of leaf area to leaf mass) and LWR (ratio of leaf mass to total plant mass).
Ecological and agronomic implications for managed and natural communities are considered in this section in the context of growth responses to light, temperature and CO2 concentration. The same principles apply to the analysis of effects of nutrients on growth, and to interactions between environmental variables.
6.2.1 - Light
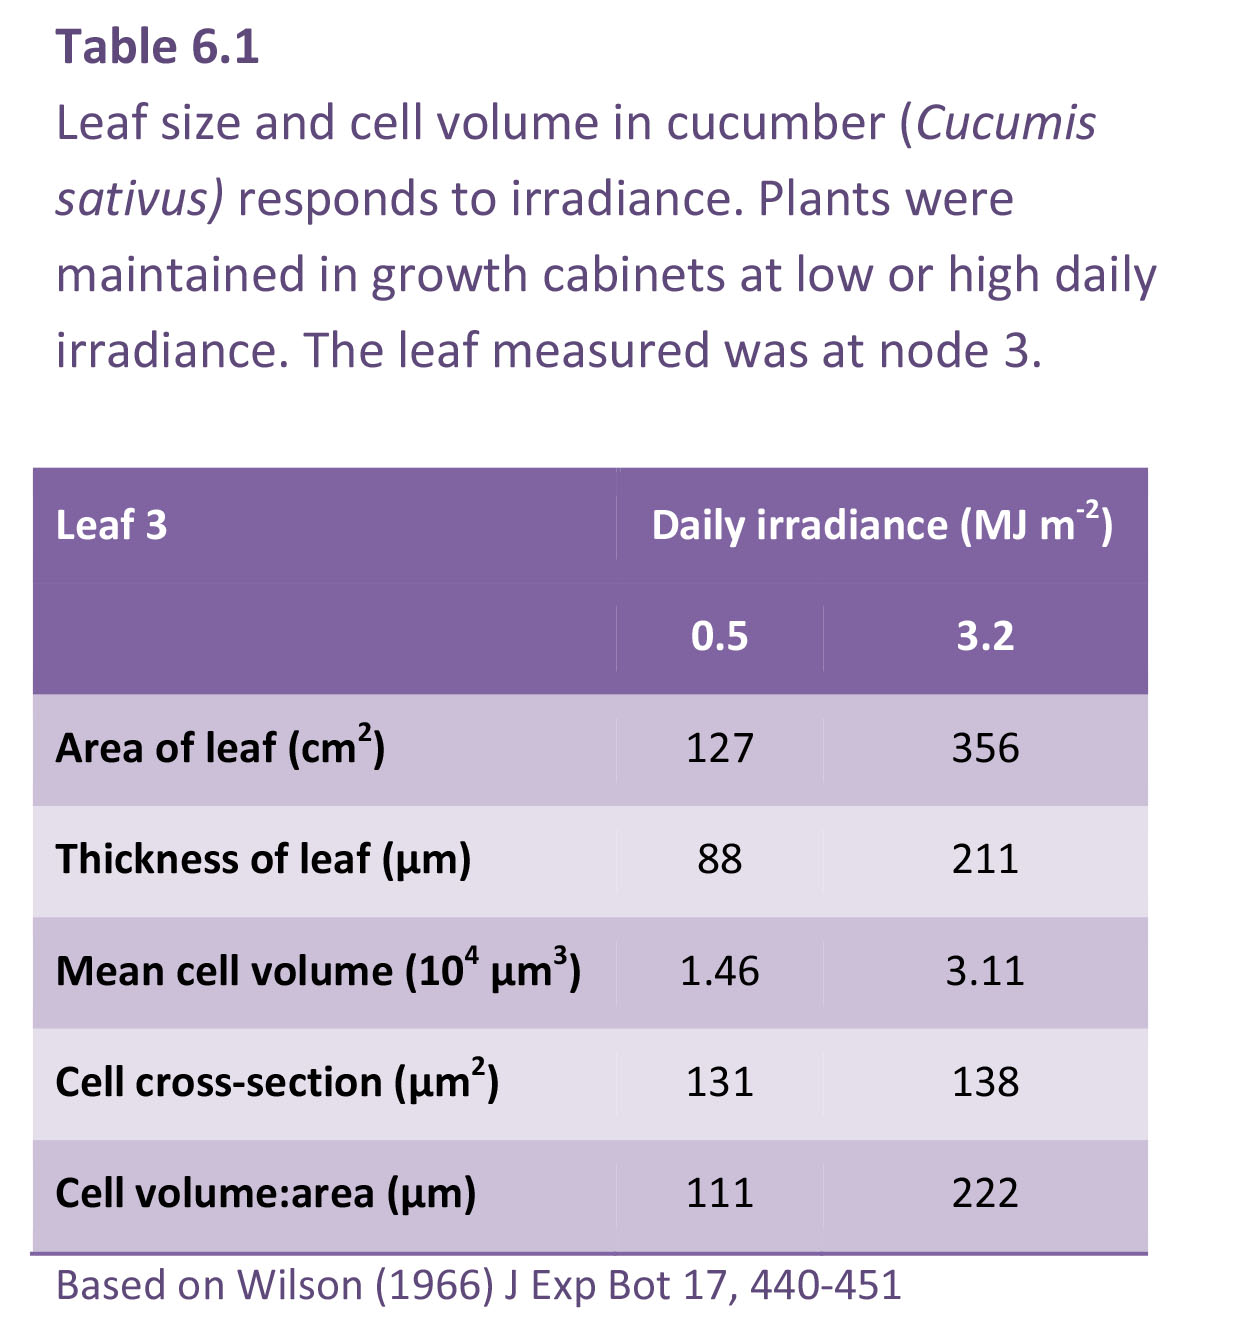
Light impacts both photosynthetic activity and morphology of individual leaves and of plant canopies. Leaves are larger at higher light. Leaf area increases because of more cells per leaf rather than by cells having a larger surface area. Cells volume, however, increases and gives rise to substantial increases in leaf thickness. This is usually achieved by a greater depth of palisade cells, either greater in depth or an extra layer of cells.
In the example shown for cucumber in Table 6.1, high light caused a three-fold increase in area, but the cell cross-section was the same, indicating that the leaves had three times the number of cells. The cell volume more than doubled under high light (3.11 × 10⁻⁵ mm3 at 3.2 MJ m–2 s–1 cf. 1.46 × 10⁻⁵ mm3 at 0.5 MJ m–2 d–1), and because cross-sectional area was virtually unchanged, cell depth was responsible. This greater depth of palisade cells in strong light confers a greater photosynthetic capacity (per unit leaf area) and translates into larger values for NAR and a potentially higher RGR. At lower irradiance (Table 6.1) leaves are thinner and SLA will thus increase with shading. Because LAR = SLA × LWR (Equation 6.9) a smaller leaf area at lower irradiance is offset to some extent by a higher SLA for maximum light capture with the most efficient use of resources.
The significance of LAR × NAR interaction for whole-plant growth was appreciated early by G.E. Blackman (Agriculture Dept, Oxford University), who in a series of papers analysed shade-driven growth responses for many species. RGR response to growing conditions in low light, and the degree to which upward adjustment in LAR could offset reduced NAR, was a recurring theme. In a series of 20 pot experiments, Blackman and Wilson (1951a) established a close relationship between NAR and daily irradiance where shade-dependent reduction in NAR was similar for 10 species. NAR was linearly related to log irradiance, and extrapolation to zero NAR corresponded to a light-compensation point of 6–9% full sun for eight species, and 14–18% full sun for two others. Significantly, neither slope nor intercept differentiated sun-adapted plants such as barley, tomato, peas and sunflower from two shade-adapted species (Geum urbanum and Solanum dulcamara). LAR proved especially responsive to light and accounted for contrasts between sun plants and shade plants in their growth response to daily irradiance.
Concentrating on sunflower seedlings, Blackman and Wilson (1951b) confirmed that NAR increased with daily irradiance (Figure 6.2) and that LAR was greatly decreased (Figure 6.2). Response in RGR reflected LAR and especially in young seedlings which also showed highest RGR and were most sensitive to shading. LAR appeared sensitive to both daily maxima as well as daily total irradiance.
Fig6.2.png
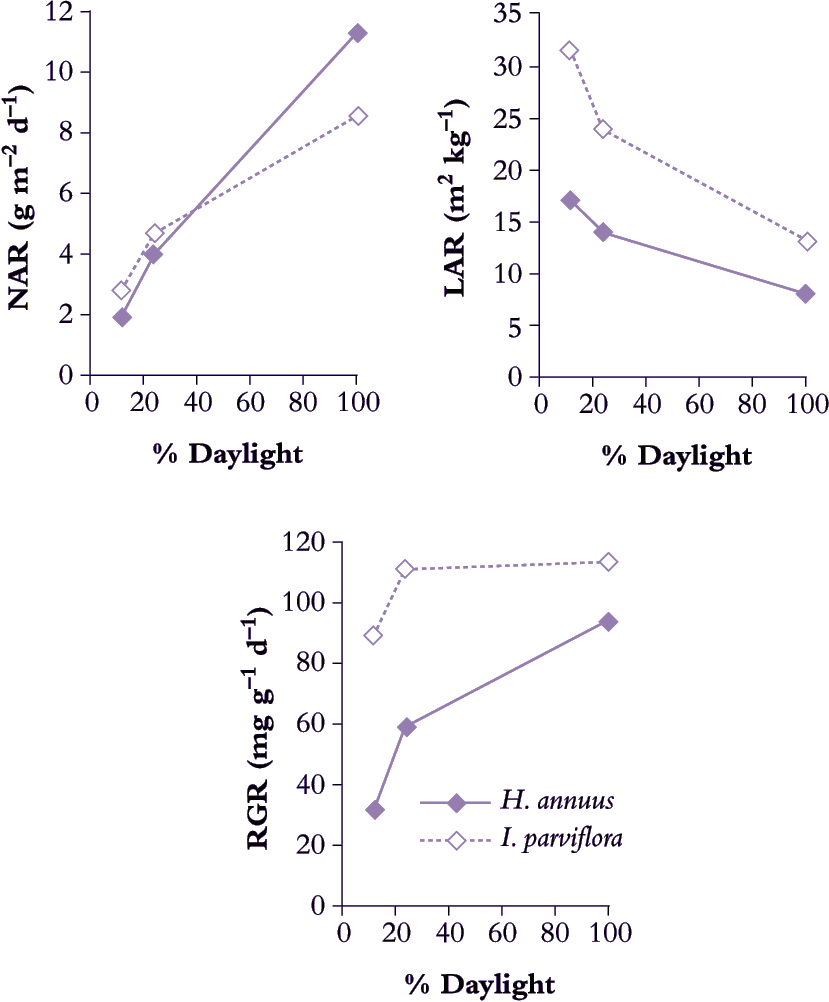
Figure 6.2 A sun-adapted plant such as Helianthus annuus adjusts LAR to some extent in response to lower daily irradiance but not enough to maintain RGR. By contrast, a shade-adapted plant such as Impatiens parviflora with somewhat higher LAR and RGR in full sun makes further adjustment in LAR so that RGR does not diminish to the same extent in moderate or deep shade as does that of H. annuus (Based on Blackman and Wilson 1951b; Evans and Hughes 1961)
A comparison between sunflower (Blackman and Wilson 1951b) and the woodland shade plant Impatiens parviflora (Evans and Hughes 1961) confirms this principle of LAR responsiveness to irradiance (Figure 6.2). Sunflower achieved noticeably higher NAR in full sun than did I. parviflora, but LAR was considerably lower, and translated into a somewhat slower RGR for sunflower. This species contrast was much stronger in deep shade (12% full sun) where RGR for I. parviflora had fallen to 0.090 d–1 whereas sunflower was only 0.033 d–1. Clearly, I. parviflora is more shade tolerant, and retention of a faster RGR in deep shade is due both to greater plasticity in LAR as well as a more sustained NAR. Adjustments in both photosynthesis and respiration of leaves contribute to maintenance of higher NAR in shade-adapted plants growing at low irradiance.
6.2.2 - Temperature
Within a moderate temperature range readily tolerated by vascular plants (10–35°C, see Chapter 14) processes sustaining carbon gain show broad temperature optima. By contrast, developmental changes are rather more sensitive to temperature, and provided a plant’s combined responses to environmental conditions do not exceed physiologically elastic limits, temperature effects on RGR are generally attributable to rate of canopy expansion rather than rate of carbon assimilation. In the early days of growth analysis, Blackman et al. (1955) inferred from a multi-factor analysis of growth response to environmental conditions that NAR was relatively insensitive to temperature, but whole plant growth was obviously affected, so that photosynthetic area (LAR) rather than performance per unit surface area (NAR) was responsible. Such inferences were subsequently validated.
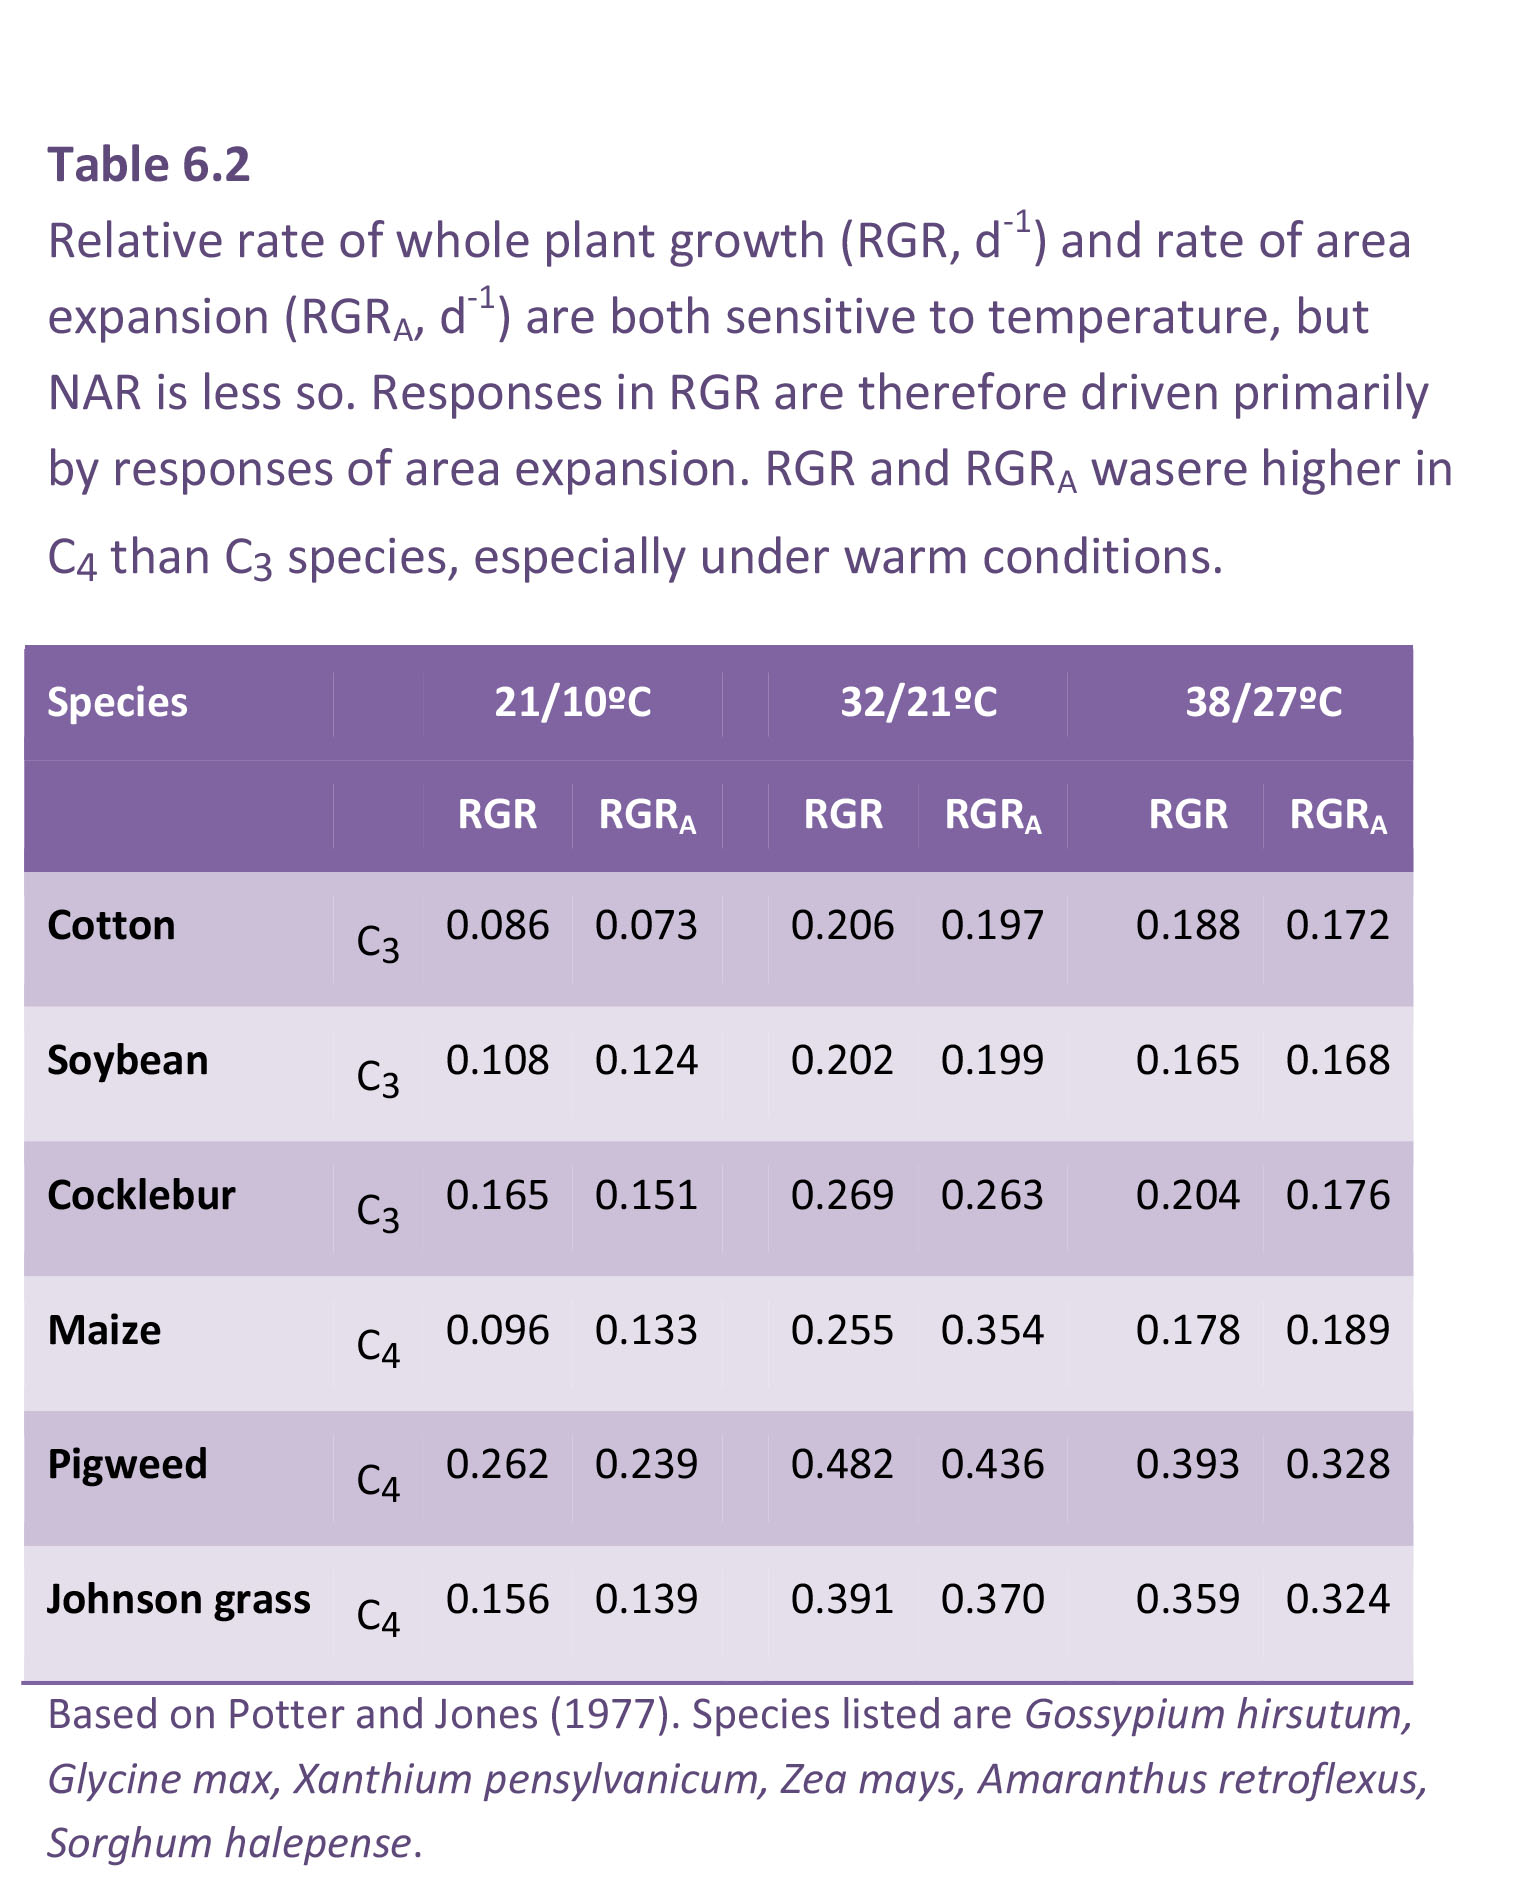
Using day/night temperature as a driving variable, Potter and Jones (1977) provided a detailed analysis of response in key growth indices for a number of species (Table 6.2). Data for maize, cotton, soybean, cocklebur, Johnson grass and pigweed confirmed that 32/21°C was optimum for whole-plant relative growth rate (RGR) as well as relative rate of canopy area increase (RGRA). Both indices were lowest at 21/10°C. This was true for C4 as well as C3 species.
C4 species had a higher RGR and RGRA than C3 species, especially under warm conditions (Table 6.2)
All populations described in Potter and Jones (1977) maintained strict exponential growth. NAR could then be derived validly and temperature effects on NAR could then be compared with temperature effects on RGR and RGRA (Figure 6.3). With day/night temperature as a driving variable, most values for NAR fell between 10 and 20 g m–2 d–1. Correlation between NAR and RGR was poor (Figure 6.3). By contrast, variation in both RGR and RGRA was of a similar order and these two indices were closely correlated (Figure 6.3).
Fig6.3.png
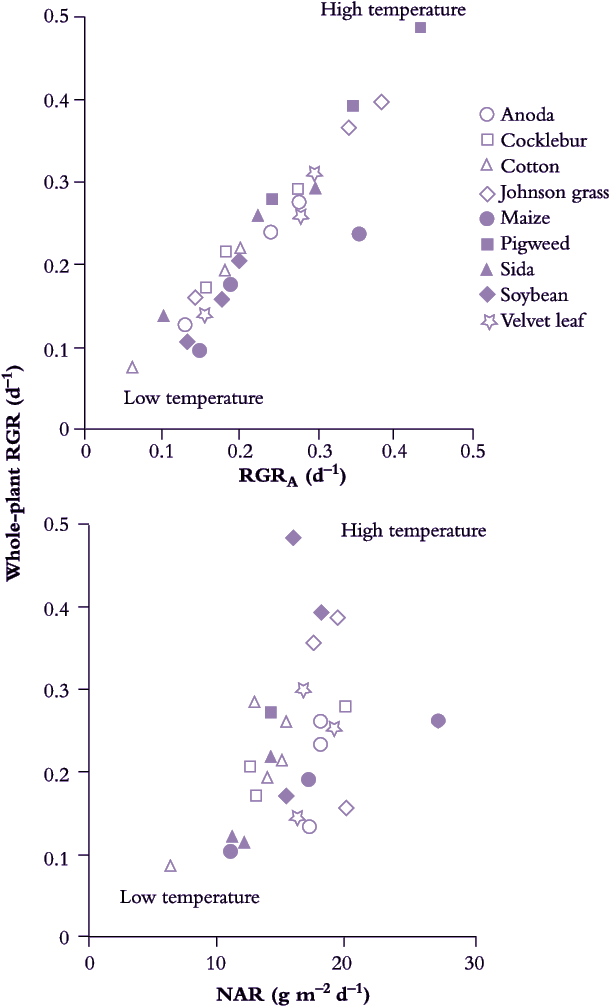
Figure 6.3 Variation in whole-plant RGR is linked to relative rate of canopy expansion (RGRA). Nine species (including C3 and C4 plants) grown under three temperature regimes (21/10 °C, 32/21 °C and 21/27 °C day/night) expressed wide variation in RGR that showed a strong correlation with RGRA but was poorly correlated with variation in NAR. Extent rather than activity of leaves appears to be more important for RGR response to temperature. (Based on Potter and Jones 1977)
A later chapter in this book, Chapter 14, explains the effect of temperature on growth of different plant species, with particular focus on adaptation to very low and very high temperatures.
6.2.3 - Carbon dioxide
Fig6.4.jpg
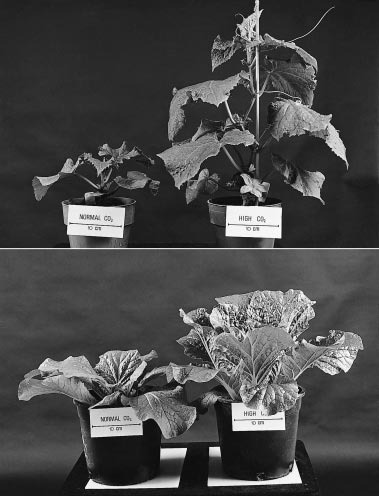
Figure 6.4 Early growth of cucumber (Cucumis sativus, top panel) and wong bok (Brassica pekinensis, bottom panel) is greatly enhanced in elevated CO2 (1350 ppm) compared with ambient controls (330-350 ppm). As shown here, that initial effect is still apparent after 52 d of greenhouse culture in nutrient rich potting mix. Scale bar = 10 cm. (Further details in Kriedemann and Wong (1984) and Table 6.3) (Photographs courtesy M. Whittaker)
Growth responses to elevated CO2 can be spectacular, especially during early exponential growth (Figure 6.4) and derive largely from direct effects of increased CO2 partial pressure on photosynthesis. C3 plants will be most affected, and especially at high temperature where photorespiratory loss of carbon has the greatest impact on biomass accumulation.
Global atmospheric CO2 partial pressure is expected to reach 60–70 Pa (600–700 ppm) by about 2050 so that growth response to a CO2 doubling compared with 1990s levels has received wide attention. Instantaneous rates of CO2 assimilation by C3 leaves can increase two- to three-fold in response to such elevated levels of CO2, but the short-term response is rarely translated into biomass gain by whole plants where growth and reproductive development can be limited by low nutrients, low light, low temperature, physical restriction on root growth (especially pot experiments) or strength of sinks for photoassimilate. Given such constraints, photosynthetic acclimation commonly ensues. Rates of CO2 assimilation (leaf area basis) by CO2-enriched plants, grown and measured under high CO2, will match rates measured on control plants at normal ambient levels.
Fig6.5.png
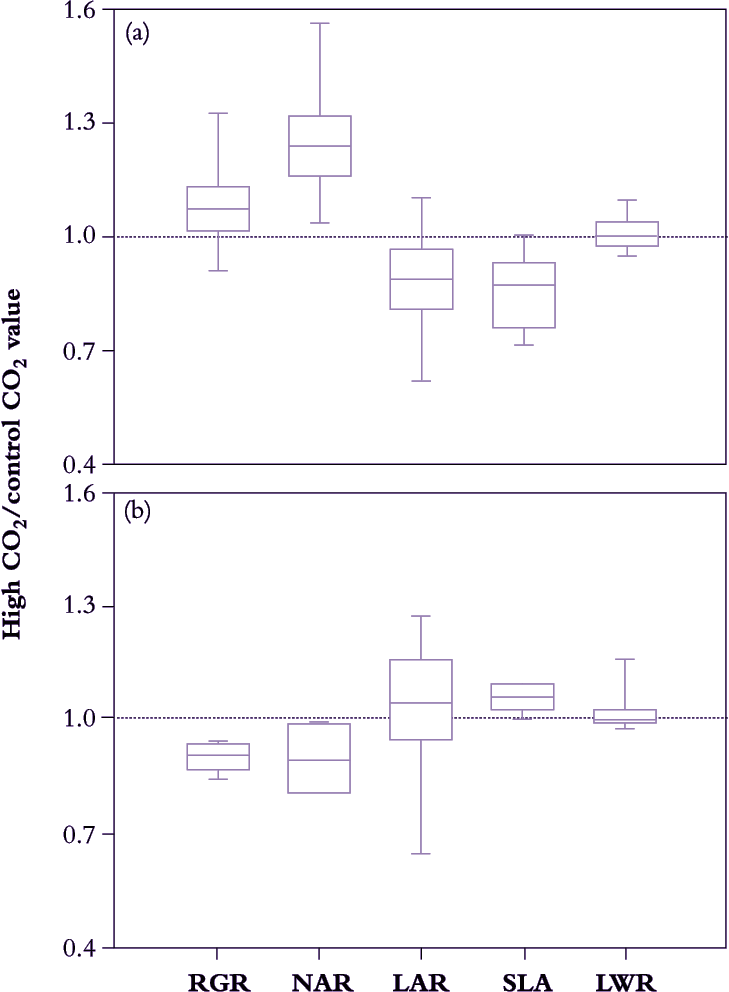
Figure 6.5. A survey of growth response to elevated CO2 (ratio of growth indices in 600-800 cf. 300-400 ppm CO2) in 63 different C3 species (a) and eight C4 species (b) reveals systematic differences in median values for growth indices that relate to photosynthetic mode. C3 plants show a positive response in NAR that results in slightly faster RGR despite some reduction in LAR. C4 plants reduce RGR under elevated CO2 due to diminished NAR. SLA of C3 plants is generally lower under elevated CO2, but increased somewhat in C4. LWR is essentially unchanged in either group (Based on Poorter et al. 1996)
Acclimation takes only days to set in, and because plant growth analysis commonly extends over a few weeks, CO2-driven responses in growth indices tend to be more conservative compared with instantaneous responses during leaf gas exchange. C4 plants will be less affected than C3 plants (see Chapter 2) so that broad surveys need to distinguish between photosynthetic mode. For example, in Figure 6.5, average NAR for 63 different cases of C3 plants increased by 25–30% under 600–800 ppm CO2 compared with corresponding values under 300–400 ppm CO2. However, NAR increase was not matched by a commensurate response in RGR, and decreased LAR appears responsible. CO2-enriched plants were less leafy than controls (i.e. lower LAR), but not because less dry matter was allocated to foliage (LWR was on average unaltered). Rather, specific leaf area (SLA in Figure 6.5) decreased under high CO2 so that a given mass of foliage was presenting a smaller assimilatory surface for light interception and gas exchange. Accumulation of non-structural carbohydrate (mainly starch; Wong 1990) is commonly responsible for lower SLA in these cases, and in addition generally correlates with down-regulation of leaf photosynthesis.
By contrast, in C4 plants LWR was little affected by elevated CO2, but in this case SLA did show slight increase with some positive response in LAR. However, photosynthetic acclimation may have been more telling because NAR eased and RGR even diminished somewhat under elevated CO2.
Global change, with attendant increase in atmospheric CO2 over coming decades, thus carries implications for growth and development in present-day genotypes and especially the comparative abundance of C3 and C4 plants. Elevated CO2 also has immediate relevance to greenhouse cropping. In production horticulture, both absolute yield and duration of cropping cycles are factors in profitability. Accordingly, CO2 effects on rate of growth as well as onset of subsequent development are of interest.
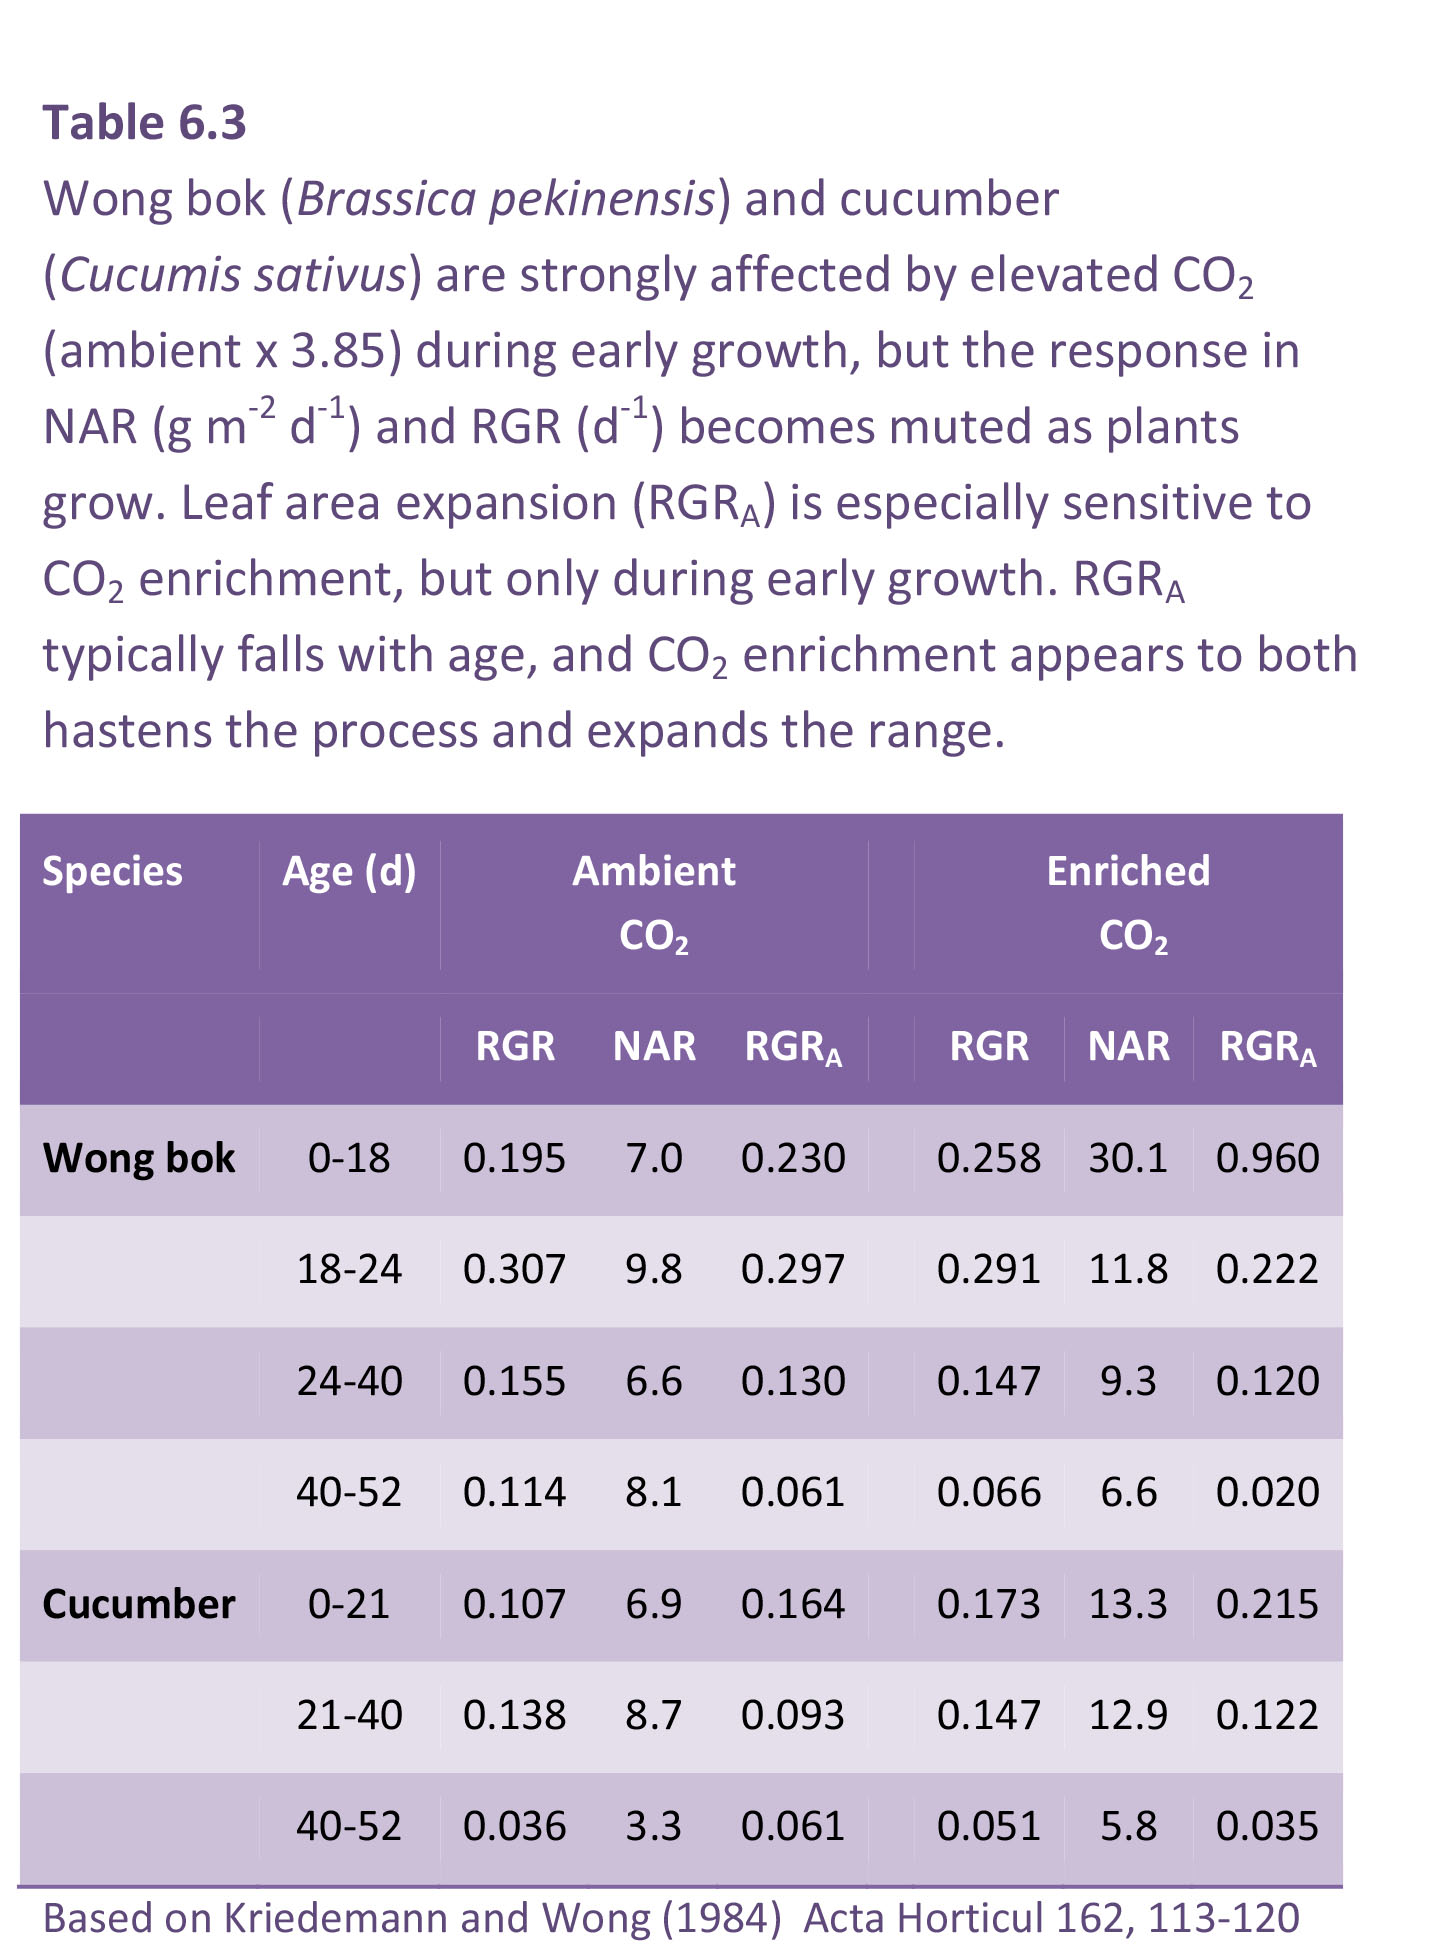
Young seedlings in their early exponential growth phase are typically most responsive to elevated CO2, so that production of leafy vegetables can be greatly enhanced. This response is widely exploited in northern hemisphere greenhouse culture. In commercial operations, ambient CO2is often raised three- to four-fold so that growth responses can be spectacular (Figure 6.4) but they tend to be short lived (Table 6.3), as accelerated early growth gives way to lower RGR. During each cycle of growth and development, annual plants show a sigmoidal increase in biomass where an initial exponential phase gives way to a linear phase, eventually approaching an asymptote as reproductive structures mature. If CO2 enrichment hastens this progression, a stage is soon reached where RGR is lower under elevated CO2 due to accelerated ontogeny.
The fall in RGR with time of exposure to high CO2 is illustrated for wong bok (Brassica pekinensis) in Table 6.3. Wong bok is a highly productive autumn and winter vegetable that serves as ‘spring greens’ and is especially responsive to CO2 during early growth. RGRA at c. 330 ppm CO2 was initially 0.230 d–1 compared with 0.960 d–1 at c. 1350 ppm CO2, but by 40–52 d, RGRA had fallen to 0.061 and 0.020 d–1 for control and CO2 enriched, respectively (Table 6.3). CO2-driven response in NAR and RGR also diminished with age, and especially where these larger individuals failed to sustain higher RGR past 18 d (Table 6.3). Nevertheless, a response in NAR was maintained for a further two intervals so that a CO2 effect on plant size was maintained (Figure 6.4).
Component analyses of RGR as exemplified above are also useful for analysing whole plant responses to the supply of various nutrients and to interactions between nutrient supply and light, temperature or CO2. There are also strong interactions between these ambient conditions and abiotic stresses such as drought and salinity that can be quantitatively analysed.
The following two sections consider the developmental stages of leaf, shoot and reproductive organ formation, and how this information contributes to different types of quantitative growth analyses.