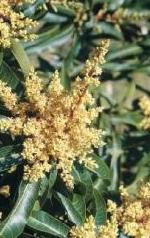
Mango inflorescence developing from vegetative shoots showing the result of meristems changing in morphology and function during the plant life cycle. (Photograph courtesy C.G.N. Turnbull)
Chapter editor: Rana Munns
Contributing Authors: JS Boyer1, ME Byrne2, R Munns3
1University of Missouri, Columbia, USA; 2School of Biological Sciences, University of Sydney; 3School of Agriculture and Environment, University of Western Australia
With acknowledgements to authors and editors of Chapter 7 of Plants in Action, 1st edition (BJ Atwell and CGN Turnbull)
Mango inflorescence developing from vegetative shoots showing the result of meristems changing in morphology and function during the plant life cycle. (Photograph courtesy C.G.N. Turnbull)
Seeds germinate, shoots and roots develop, then plants flower and set fruit. Reproduction can occur sexually or asexually. This is the essence of plant life cycles – an alternation of vegetative and reproductive phases – and applies equally well to ephemeral annual species as to centuries-old trees.
In this chapter we show how the vegetative plant axis develops, and the transition to flowering or formation of asexual propagules occurs. Growth occurs by cells in the apical meristems dividing and subsequently enlarging, and taking shape. These are the “growth zones” and occur at root tips of all plants and in different parts of the shoot in monocots and dicots. Plant water status is important: a minimum turgor is necessary for cell growth, but the rate, longevity, and direction of cell growth is regulated by complex processes of signalling. The essential role of the cell wall in controlling growth rate, cell shape, and organ morphology is emphasised.
This Chapter explains the process of vegetative growth and the transition to reproduction. Chapter 8 presents the environmental signals that influence these developmental patterns, allowing optimisation and synchronisation with seasonal cycles of fluctuating climate.
A vascular plant begins its existence as a single cell, the zygote. The early embryo derived from growth of a zygote is globular whereas a mature embryo has a defined apical–basal growth axis (Figure 7.1). In other words, it has become a polar structure.
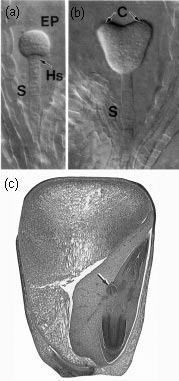
Figure 7.1 (a,b) Typical dicotyledonous embryo (Arabidopsis thaliana) showing suspensor (S) at globular and heart stages. EP = embryo proper, Hs = hypophysis, C = cotyledons. Photographed with Nomarski optics. (c) Mature monocotyledonous embryo within maize grain. The shoot apex (with coleoptile and pre-formed leaves, together with scutellum), root apex and an adventitious root (arrowed) are all visible. (Based on Yadegari et al. 1994; Raven et al. 1992)
During longitudinal axis formation, two distinct zones that subsequently retain the capacity for continuous growth are set apart at opposite poles. These regions are the apical meristems, one producing the shoot system, the other producing the root system (Figure 7.1c). These are ‘open-ended’ indeterminate growth systems from which the same kinds of organs and/or tissues are produced continuously and which result in the primary plant body. Often in response to environmental cues such as photoperiod and low temperature, the shoot apical meristem may undergo transition to a floral state. In this case, the meristem has become determinate and ceases to produce new organs. In contrast, most root meristems remain indeterminate, although lateral roots which branch off a primary axis can become determinate. Shoot buds containing meristematic cells give rise both to terminal apices and to lateral branches, for example the crown of a eucalypt and its side branches, respectively. Roots also branch profusely, but from meristematic tissue deep within the root axis, so generating extensive root systems typical of most land plants. In monocots, an intercalary meristem located at each node of the stem provides the facility for continued longitudinal growth if the shoot tip is destroyed, for example by a grazing animal or a lawnmower. Patterns of plant development contrast sharply with those of higher animals where the fundamental body plan, complete with rudimentary organs, is laid down in the embryo. In the case of animals the organ number is finite, unlike the plant body in which an indefinite number of organs such as leaves are produced from indeterminate apical meristems. Within the organs of an animal, further cell divisions replace degenerating cells whereas plant cell division primarily provides new organs to replace those lost through senescence.
The so-called primary plant body, described above, may constitute a whole plant, for example annuals like pea, cereals and Arabidopsis. However, plants with extended lifespans have additional meristem layers called cambium which develop within roots and stems, and lead to an increase in girth along the plant’s longitudinal axis (see Section 7.2). Vascular cambium generates extra conducting tissue; cork cambium produces protective tissue, replacing the functions of epidermis in stems, and cortex and epidermis in roots. Cambial meristems and their derivative tissues are referred to as the secondary plant body. Although no new organs are produced by these lateral meristems, the secondary plant body may constitute the bulk of the plant, for example a tree’s trunk, branches and roots.
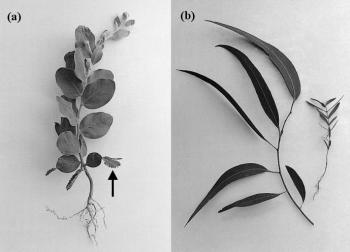
Figure 7.2 (a) The first few leaves of many Acacia seedlings often have pinnate leaves (arrow), but phyllodes (flattened petioles) take over photosynthetic functions at later nodes. (b) Juvenile seedling (opposite leaf pairs) and adult shoot (spiral phyllotaxis) forms of Eucalyptus. (Photographs courtesy C.G.N. Turnbull)
Localised meristems, whether axial or lateral, have profound implications for morphogenesis. Changes in the fate of cells emerging from meristems will be evident in the resultant tissues and organs. For example, the abrupt transition from juvenile to mature leaves in eucalypts and acacias (Figure 7.2) reflects this change of fate.
Meristems are restricted to localised regions in higher plants, but in algae cell divisions are not always organised this way. Unicellular organisms undergo divisions to produce a new biological entity capable of further cell divisions and multicellular algae often have diffuse meristems. The latter could in part reflect the less exacting demands of their homogeneous aquatic environment. Producing new cells throughout a developing thallus may be feasible simply because it is well supported under water.
Although roots are sometimes neglected by researchers and called the ‘forgotten half’ or ‘hidden half’ of plants, root apical meristems have been studied extensively for two reasons. First, roots are viewed as a simpler system than shoot meristems – the root meristem is much more accessible than the shoot meristem which is ensheathed by developing leaves. Second, complicating lateral structures arise from the terminal shoot meristem (leaf and bud initials) but not from the terminal root meristem, which produces cells solely for the primary axis. This is where the simplicity ends. A primary root meristem generates two tissues simultaneously, the main root axis extending proximally towards the shoot, and the root cap pushing relentlessly forward into the soil, succumbing to sloughing and hence rapid turnover. The detailed organisation of root meristems, which we consider here primarily from the view of the cell biologist, reveals deeper complexities and questions of cell determination.
Lateral root meristems enable generation of massive networks of fine roots. The evolutionary processes which led to root systems of a very branched nature (e.g. grasses) through to coarse unbranched root systems (e.g. orchids) are a fascinating basis for further research into control of root branching. In addition, molecular intervention is giving us new plant forms which can be used to unravel the controls on root development and branching.
Primary roots arise through controlled cell divisions in the apical meristem and subsequent expansion and differentiation of these cells. Root formation (rhizogenesis) is usually extremely rapid: daughter cells exiting the meristem may be found 24 h later in a fully differentiated structure (e.g. phloem), even though further modifications to cell function are still possible (e.g. formation of an exodermis).
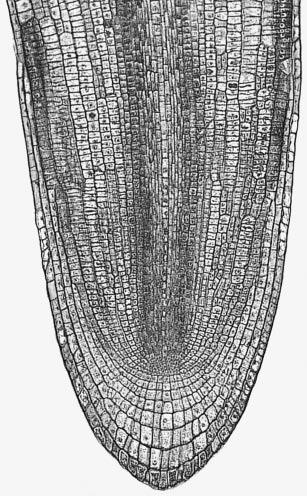
Figure 7.3 Longitudinal section through a primary root tip of radish (Raphanus sativus). Files of cells extend forward from the centre of the apex to form the root cap, and backwards to form the main root tissues. (Based on Raven et al. 1992)
Critical steps in setting up dimensions and thickness of the root axis, and supply of cells to the zone of elongation, are the rate and position of cell divisions in the meristem. This can be appreciated from the two-dimensional view of a developing radish root in Figure 7.3. Divisions can be in any of three planes, either anticlinal (normal to the root axis), periclinal (tangential to the root axis) or radial to the axis. These divisions will give rise, respectively, to increased root length, increased root thickness (more layers of cells through the root), or increased root circumference. The apical meristem supplies all the cells for the primary root axis and the consequences of the planes of cell division are evident long after meristematic activity ceases.
Separate cell divisions at the leading edge of the root meristem generate a root cap which extends forward as a protective structure. The central cells of the root cap are often oriented in longitudinal arrays (columella) and are destined for rapid attrition as the ‘advancing’ soil particles slough off the surface layers. These cells also fulfil a vital chemico-physical role by secreting a glycoprotein-rich mucigel which reduces friction between root and soil matrix. Root caps advance at a dramatic speed: a root might elongate by 5 cm per day and new root cap cells can be pushed in advance of the apex of the primary axis at about the same rate. This means that the leading tip of a primary root, supplied with new root cap cells, advances through the soil at up to 60 µm min–1. The sloughing off of roughly one cell layer per hour may explain our observation that the root cap does not increase in size over time. Intriguingly, root caps are still conspicuous in roots grown in nutrient solutions but still never dominate the primary root axis, so we deduce that sloughing off may induce a feedback mechanism that upregulates root cap meristem activity.
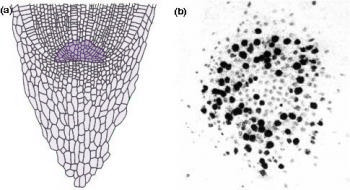
Figure 7.4 Most root apices contain a quiescent centre of very slowly dividing cells. (a) Diagram of longitudinal section through a maize (Zea mays) root tip. The quiescent centre is shaded dark green. (b) Autoradiograph of transverse section through root apex of Vicia faba (broad bean), fed for 24 h with radioactive [3H]thymidine which specifically labels DNA in nuclei of dividing cells. The quiescent centre has significantly fewer labelled cells (dark silver grains). (Based on Clowes 1959; Waisel et al. 1996)
Another remarkable feature of root apices is the quiescent centre, a paradox at the heart of the meristem (Figure 7.4). The quiescent centre is a zone of relatively inactive, slowly dividing cells, numbering about 500–600 in a mature maize root. Its discovery (Clowes 1959) involved studies on mitotic frequencies, thymidine incorporation into nuclear DNA (Figure 7.4b), and ploidy after colchicine treatment. These led to a radical change in view of plant roots. The quiescent centre functions as a reserve of cells which can survive stresses and provide cells to a regenerating meristem. Recovery from surgical removal of parts of the meristem and irradiation to destroy dividing cells supports this concept. Likewise, short determinate lateral roots often lack a quiescent centre, suggesting it is closely tied to sustained indeterminate development.
Passage of cells from meristem to differentiated structures has been studied in simple roots such as ferns in which a single apical cell can be the progenitor of all root cells. Higher plants such as maize or beans have more complex roots, but the whole root can still be traced back to as few as 12 cells in the middle of the quiescent centre (Lyndon 1990). Cell destiny appears to follow predictable patterns, suggesting the notion of clonal development in which cell fate is fixed from the first divisions in the meristem. This view is under challenge from experiments using laser ablation. Individual cells, or groups of cells, can be eliminated by laser treatment, then the behaviour of adjacent cells is followed to see how the meristem is organised. This demonstrates that cells have considerable scope for taking over the meristematic role of their nearest neighbours. However, the process depends on physical contact between dividing cells and their daughter cells, which suggests a local transfer of information. The implication is that cell fate and the asymmetric divisions which give rise to various cell lines are regulated at a tissue level, but we do not yet know the nature of the mobile signals which might program cells in the meristem. We next turn to the fate of cells in their temporal journey from division to differentiation.
Cells divide in planes which are identifiably targeted to become the various root tissues even before all cell divisions are complete. For example, cells giving rise to the stele are generally clustered around the axis of the root, proximal to the quiescent centre (Figure 7.4a), while those giving rise to outer tissues (endodermis, cortex and epidermis) are peripheral to the pre-stelar cells. In roots of Arabidopsis, which has become a favoured plant for this work, the numbers of cells which generate individual tissues (e.g. eight meristematic cells generate eight cortical files) are known and the order of divisions giving rise to tissues such as pericycle, cortex and endodermis have been defined.
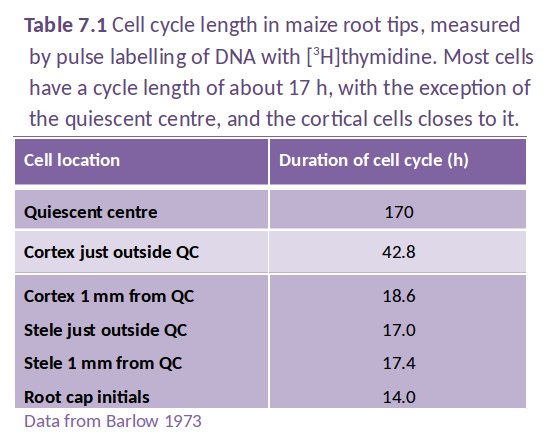
The changes which cells undergo in root meristems are profound; mitotic activity is most rapid in the distal regions (with a mitotic index of up to 23% in some files) but the mitotic cycle slows dramatically within 0.5–1.0 mm from a wheat apex. Surprisingly, mitotic frequency in adjacent cell files can vary widely (Figure 7.5; Table 7.1).
The rate and plane of cell division and subsequent rate of cell elongation determine the rate of delivery of new cells to mature root tissues. The coordination of cell flux is presumably under tight control, achieving the final anatomical outcomes recognisable as mature roots – single layers of pericycle and endodermal cells, long conducting vessels and epidermal cells are some examples. The role of growth in cells exiting the meristem and the direction of expansion are major factors in rhizogenesis, with a 30- to 150-fold volume expansion required to generate the primary axis.
Figure 7.5 Cell division rates vary along different zones of the root apical meristem. Frequency of observed cell division is represented by different densities of stippling (onion root tip). (Based on Jensen and Kavaljian 1958)
Lateral roots are important in nutrient and water uptake (Chapter 4.1). The cellular reorganisation which leads to lateral root primordia forming and developing into new axes starts with a latent meristematic activity in the root pericycle being de-repressed and cell divisions resume. Occasionally, endodermal cells are also recruited. Periclinal divisions underlie the out-growth of cells and disruption of the outer tissues of the root. However, before the cortex and epidermis have been penetrated by the young lateral root, it has formed its own terminal meristem and root cap. The new organ is thus prepared for growth in the external matrix. Lateral roots formed from the pericycle must breach the endodermis of the parent root. How is this achieved without rupturing of the Casparian strip and preventing outflow of concentrated nutrients to the cortex? Dyes which penetrate only the apoplasm have shown that endodermal disruption is a transient feature of lateral root growth, but the consequences are not well understood.
Lateral roots generally do not form within 1 cm from the terminal apex, and almost never in the zone of elongation. This makes sense as laterals in the growing zone would act as barbs impeding growth of the primary axis through the soil. An exception which supports this view comes from Eichhornia (water hyacinth) which does produce laterals in the elongation zone very near the root tip, but because of its aquatic environment this does not interfere with growth.
Shoot apical meristems are minute yet complex structures that are ensheathed within new developing leaves or bracts. A vegetative meristem gives rise to leaves or other organs, for example thorns and tendrils. Axillary buds are themselves complete shoot meristems from which branches are produced (cf. lateral roots described above). In angiosperms, when a plant shifts from vegetative to reproductive growth some meristems undergo a transition to the reproductive state and give rise either to multiple flowers in an inflorescence, as in mango (Figure 7.6a), or to a single terminal flower, for example a poppy or waterlily (Figure 7.6b). All axial growth from meristems, be they vegetative or floral, is continuous or indeterminate until topped by the formation of a flower. When this occurs, floral organ primordia arise in whorls from the shoot meristem and differentiate into the familiar sepals, petals, stamens and carpels.
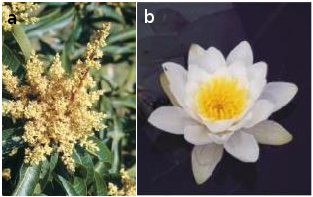
Figure 7.6 Shoot meristems change morphology and function throughout the life cycle, leading to different mature structures. (a) Indeterminate inflorescence of mango; (b) determinate single flower of a waterlily. (Photographs courtesy C.G.N. Turnbull)
Sometimes, however, the indeterminate inflorescence meristem reverts back instead to a vegetative status. Think of a bottlebrush or a pineapple with a leafy axis extending beyond the flower or fruit (Figure 7.7). What determines whether a meristem is vegetative or floral? In many species, environmental signals cause the switching between vegetative and floral states and a picture is now emerging of the genes and molecular mechanisms responsible for defining structures that are generated by meristems.
Although meristems function as generic sources of cells for differentiation into organs, each type of meristem is programmed to produce only certain structures. Across all species, there is a small, finite range of these structures, yet we observe an amazingly diverse array of final vegetative and floral morphologies. A leaf is always recognisable as a leaf but consider the vast structural differences between a pine needle, a waterlily pad and a tree fern frond. The generation and spatial patterning of plant organs are determined by early events within the vegetative meristem. This precise positioning of organs around the shoot meristem is called phyllotaxis. Later in development, a dramatic meristematic switch will give rise to a terminal inflorescence, often with an abrupt change in patterning of organs. Phyllotaxis also applies to floral structures, for example spiral patterns of scales of a pine cone or bottlebrush flowers (Figure 7.7).
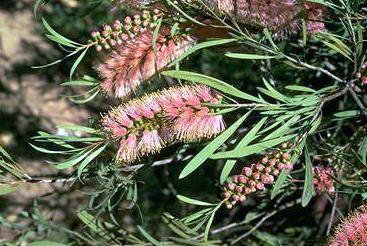
Figure 7.7 Alternating phases of vegetative and reproductive growth in the bottlebrush Callistemon ‘Pink Perth’). Spiral phyllotaxis is visible in the young inflorescence. (Photograph courtesy M. Fagg, ANBG)
Organ spacing is a final determinant of shoot appearance. For example, leaves forming a rosette as in Arabidopsis are separated by short internodes compared with longer internodes intervening between whorls of leaves of a blue gum seedling. The resulting morphologies are strikingly different. The question of what determines phyllotaxis and internode length is discussed later.
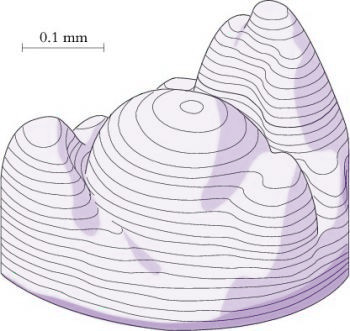
Figure 7.8 Three-dimensional reconstruction of vegetative shoot apex of lupin showing central dome and spirally arranged leaf primordia on flanks. (Based on Williams 1974)
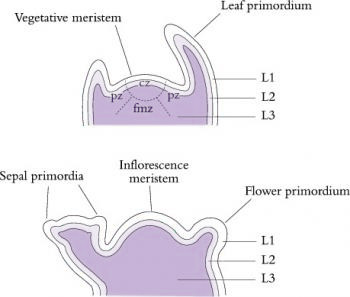
Figure 7.9 The structure and zonation of shoot apices can be described in two main ways. Zonation in vegetative apices (top) can be based on relative cell division rates and differential staining; central zone (cz, slow division rate), peripheral zone (pz) and file meristem zone (fmz). Layers of cells are usually also visible. L1 and L2 are often referred to as the tunica and L3 as the corpus. The layering remains visible during early floral development (bottom), but the central zone disappears in determinate inflorescences. (Based on Huala and Sussex 1993)
Superimposed on this functional zonation are usually three distinct cell layers which give rise to separate cell lineages (Kerstetter and Hake 1997). These cell layers, designated L1, L2 and L3, are distinguishable by their positions in the meristem and their pattern of cell divisions, and are evident in both vegetative and reproductive meristems. Surface cells of L1 divide anticlinally while within the meristem and during sub-sequent differentiation of the organs. Not surprisingly, they form the epidermis. Within the apical dome, the plane of cell division within L2 is also purely anticlinal, but later on during organ formation divisions occur in other planes. In contrast, cells of the deepest layer, L3, divide in all planes. The two inner layers, L2 and L3, contribute cells to form the body of the plant with the proportion of cells derived from each layer varying in different organ types. Although the cell lineages produced by each layer usually contribute to distinct regions within each organ, invasion of cell derivatives of one layer into another has been observed.
Invading cells differentiate in accordance with their new position, which we interpret to mean that developmental fate of cells appears to be governed more by position than by cell lineage. However, meristematic cells may already be functionally distinct as evidenced by patterns of gene expression which reflect the layered cellular organisation (Figure 7.10).
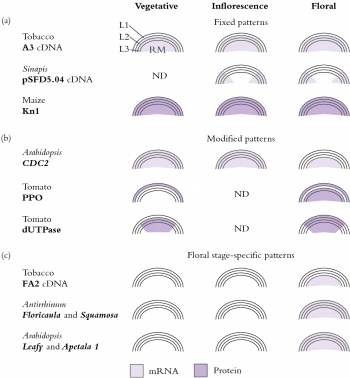
Figure 7.10 Complexities of meristem functioning are revealed by specific staining (in situ mRNA hybridisation and antibody techniques) for expression of different genes. Dark shading represents protein patterns, light shading represents mRNA expression. Many of these patterns match the zonations in Figure 7.9. (Based on Meeks-Wagner 1993)
In order to maintain the very precise organisation of vegetative meristems over long periods, or to accommodate rapid changes during flower formation, some signalling process must exist to coordinate division between the cell layers. Evidence for such signalling has been established through the development of chimeras, where genetically different cell types exist together in a single apex, yet still achieve normal developmental patterns.
We previously raised the question of what determines phyllotaxis and internode length. Organs derived from the shoot meristem can arise in whorls (two or more organs simultaneously at one node), alternately (two files displaced by 180° with a single organ at each node) or in spirals (each organ displaced from the previous one by approximately 137° with a single organ at each node). These organs may be separated by very short or long internodes. Phyllotaxis patterns are usually stable, but often change abruptly with floral induction or when seedlings undergo transition to their mature morphology. In many species of Eucalyptus, this ‘phase change’ from juvenile to adult is very striking and is accompanied by a change from whorled to alternate or spiral phyllotaxis. How is the change in phyllotaxis effected? We gain some insight from experiments on chrysanthemum meristems where application of the inhibitor of polar auxin transport TIBA (tri-iodo benzoic acid) induced changes in internode length and displacement angle between leaf primordia. The data are consistent with a change from 137° spiral (control) to alternate (50 ppm TIBA) phyllotaxis and are presumed to result from increased concentrations of auxin in the meristem resulting from inhibition of transport away from the existing primordia. Meristems are deduced to be sites of auxin synthesis (Schwabe and Clewer 1984). One interpretation is that each primordium acts as a field with a defined radius of inhibition preventing other primordia from initiating too close to it. Another option is mechanical control by pressure and tension gradients within the meristem (Green et al. 1996). Supporting evidence comes from experiments on cells in tissue culture in which applied pressure altered their morphogenetic patterns. At a whole-plant scale, tension and compression wood in trees are further examples of specific developmental responses to physical forces.
The location and activity of individual meristems give rise to the diverse morphologies we recognise within the Plant Kingdom. Palms and grass trees have a distinctive morphogenesis with the entire shoot canopy produced from the activity of a single apical meristem. Removal of the crown of a coconut palm inevitably kills the whole plant. The roots of palms and grass trees are also extraordinary in that they grow and senesce in a seasonal pattern which confers tolerance to poor soils and fire.
In contrast, woody trees produce complex shoot morphologies through combined activity of terminal and lateral apices. We see the product in the height and diverse branching pattern of large trees. Australian eucalypts show a diversity of shoot forms, ranging from the single slender trunk of a mountain ash or karri, topped by a branched canopy, to the multiple trunks of mallee eucalypts. The branching form of mallee species is determined by simultaneous activity of many apical meristems. Similarly, excavation of roots of large trees has often revealed complex branching patterns which enable effective exploration of large volumes of soil and extraction of water and nutrients. In the case of Eucalyptus marginata, a root system arises from strong meristematic activity in the surface levels of the root system as well as proliferation of deep sinker roots. Some species within the Proteaceae can form proteoid (cluster) roots that are adapted to nutrient-poor soils.
Grasses have a distinctive morphology which arises from the local activity of intercalary meristems. These meristems give rise to semi-autonomous plants called tillers which comprise leaves, stems and reproductive parts and are subtended by nodal roots. Cell divisions within the intercalary meristem are developmentally responsible for the characteristic morphology of grasses, a family that is well adapted to herbivory.
Mary Byrne, School of Biological Sciences, University of Sydney
Leaves are the main photosynthetic organs of vascular plants, and their optimisation for conversion of light to chemical energy production has resulted in a striking array of shapes. There is enormous variation in the shape of leaves of different plant species, of leaves within species, and for some species there is variation between juvenile and mature leaves on an individual plant. In the most general type of dicot leaf, there is a basal stalk or petiole and a distal flat blade or lamina. The leaf forms this structure through development in three axes; the proximal-distal (tip to base), the adaxial-abaxial (top to bottom) and the medial-lateral (middle to margin) (Figure 7.11). The adaxial-abaxial axis is evident at early stages of development of the leaf primordium. The adaxial side of the leaf is the side nearest to the shoot meristem and the abaxial side of the leaf is the side further from the meristem (Figure 7.11). These will eventually become the upper and lower sides of the leaf.
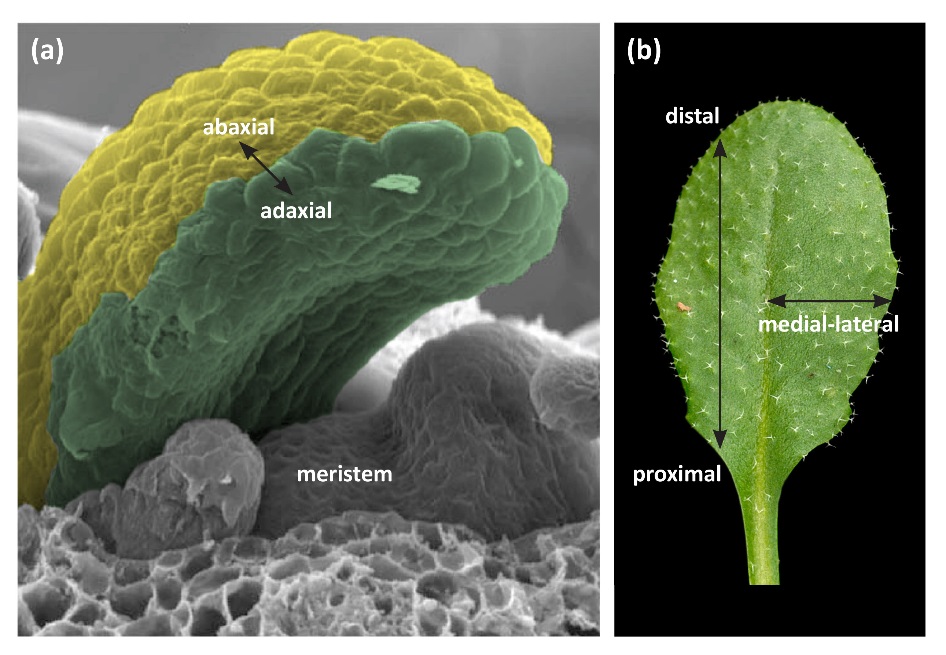
Figure 7.11 Diagram of a plant apex and mature leaf of a dicot such as Arabidopsis. (a) The shoot meristem comprises a population of undifferentiated dividing cells. Cells on the flanks of the meristem contribute to production of leaves. The adaxial-abaxial axis is marked. (b) Mature leaf showing the proximal-distal and medial-lateral axes.
The resulting basic leaf shape is a flat, planar structure but modifications during development result in variations on the basic shape. For example, other shapes include leaves that are flattened along a lateral dimension or are radial, such as tendrils of Pisum sativum (pea) leaves or spines in many cacti. Varying degrees of serrations and lobing at the leaf margins also contribute to differences in leaf shape. For instance, within Australian Banksia, B. grandis leaves have deeply indented margins, whereas B. integrifolia leaves have smooth margins (Figure 7.12).
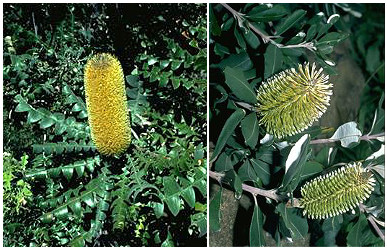
Figure 7.12 Contrasting leaf shape of (left) Banksia grandis and (right) Banksi integrifolia. (Photographs courtesy M. Fagg and D. Greig, ANBG)
In addition to these types of elaborations, the leaf lamina may be a simple undivided shape or may be complex and subdivided into leaflets. Complex or compound leaves are found in many species including tomato (Solanum lycopersicum) and pea (Pisum sativum) (Figure 7.13).
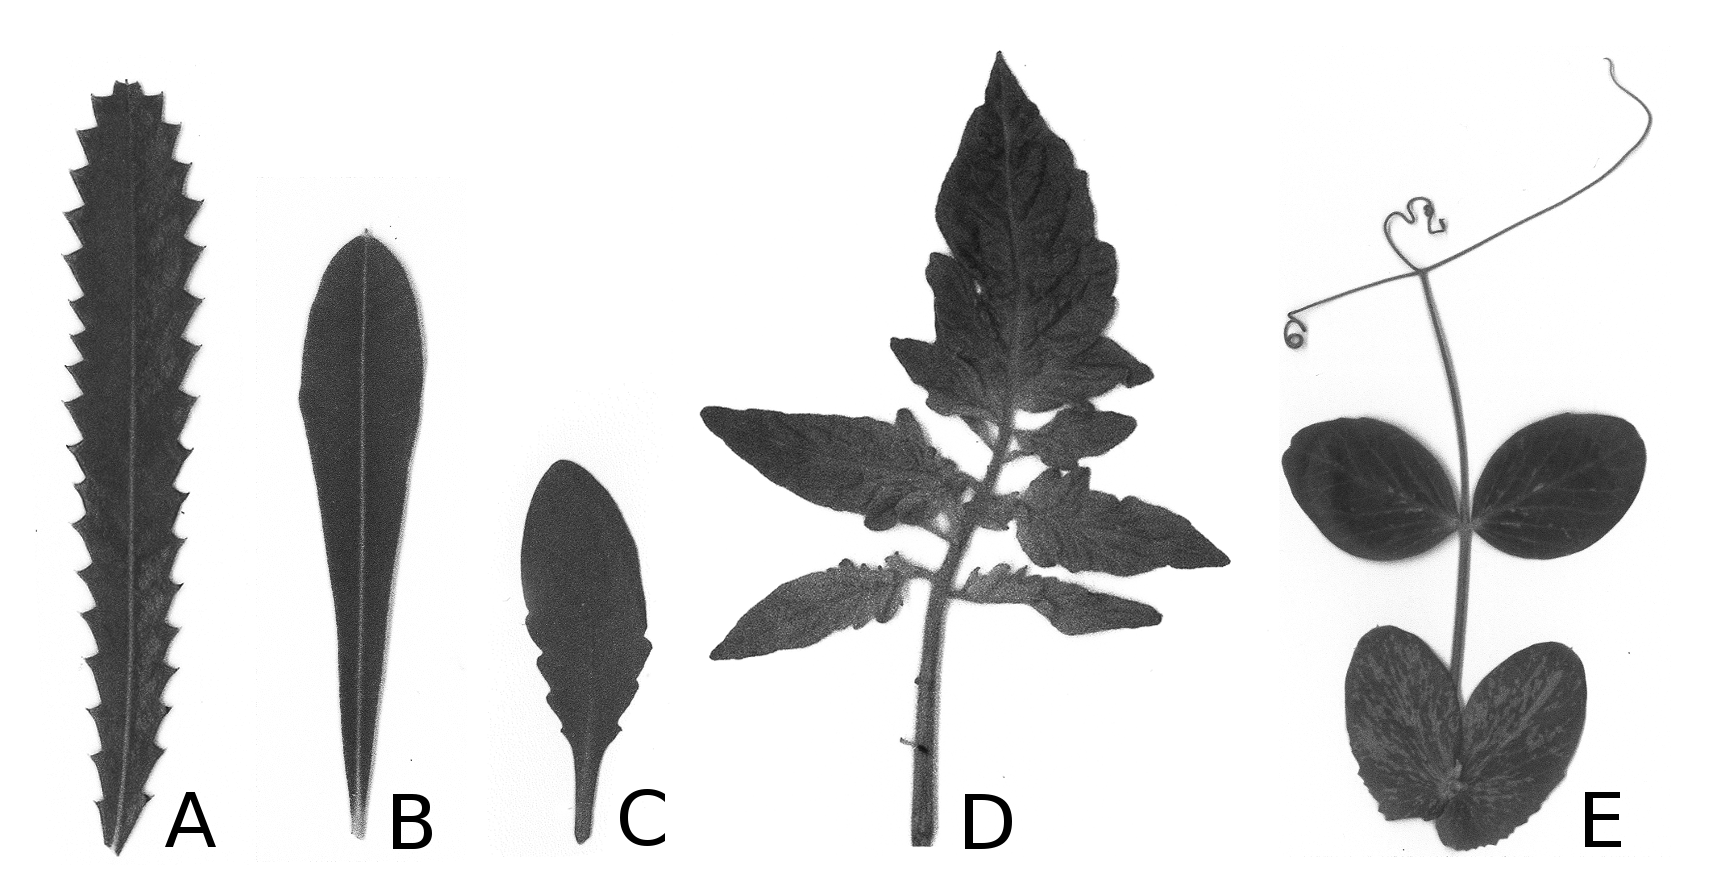
Figure 7.13 Leaf shape variation. Banksia serrata leaf has serrated margins (A) and B. integrifolia leaf has smooth margins (B). The leaf of Arabidopsis thaliana is simple with small marginal serrations (C). The leaf of tomato is compound and a single leaf has primary and secondary leaflets (D). The leaf of pea is compound and includes central leaflets, proximal stipules and distal radial tendrils (E).
Different leaf shapes may be produced during the life of the plant, and may be influenced by environmental conditions. For instance many Eucalyptus species have short, broad juvenile leaves and narrow, elongated adult leaves. Leaves in Acacia species change with plant maturity where juvenile leaves have a dissected leaf lamina and adult leaves (which are a modified petiole, or phyllode), are simple in shape (Figure 7.14).
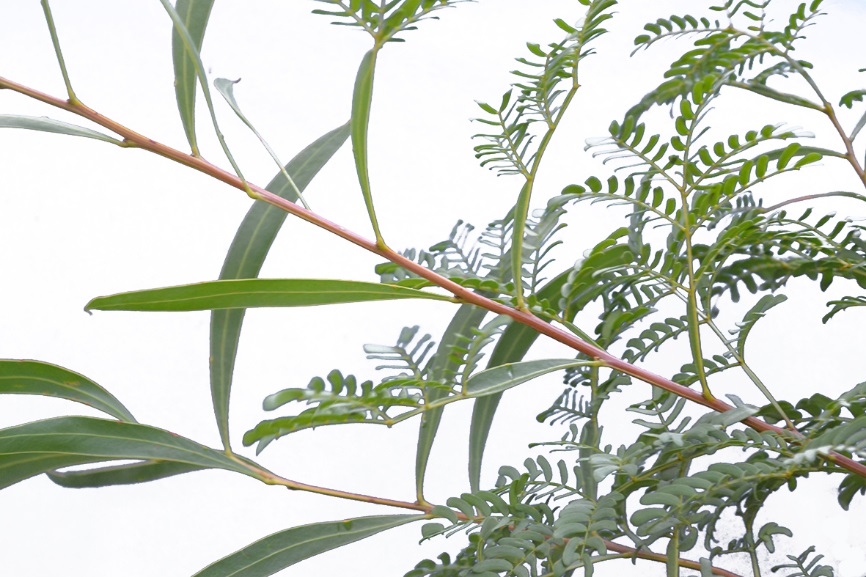
Figure 7.14 Branch of an Acacia species showing two leaf shapes on the one plant. The juvenile leaves are compound leaves and are subdivided into leaflets. The adult leaves (phyllodes) are simple in shape.
Leaves initiate in peripheral regions of the shoot meristem (Figure 7.15). Sites of initiation occur where the hormone auxin forms a localised maximum. Local high levels of auxin are achieved through the action of a membrane-localised auxin efflux carrier PIN-FORMED1 (PIN1). The distribution of PIN1 to the plasma membrane on just one side of cells leads to directed flux of auxin away from sites where organs have already initiated and toward the site where organs will next form (Figure 7.15). Coincident with high levels of auxin, class I homeodomain transcription factor KNOX genes are down-regulated in initiating organs. Class I KNOX genes are expressed in the shoot meristem and are essential to maintain growth of the shoot meristem (Figure 7.15).
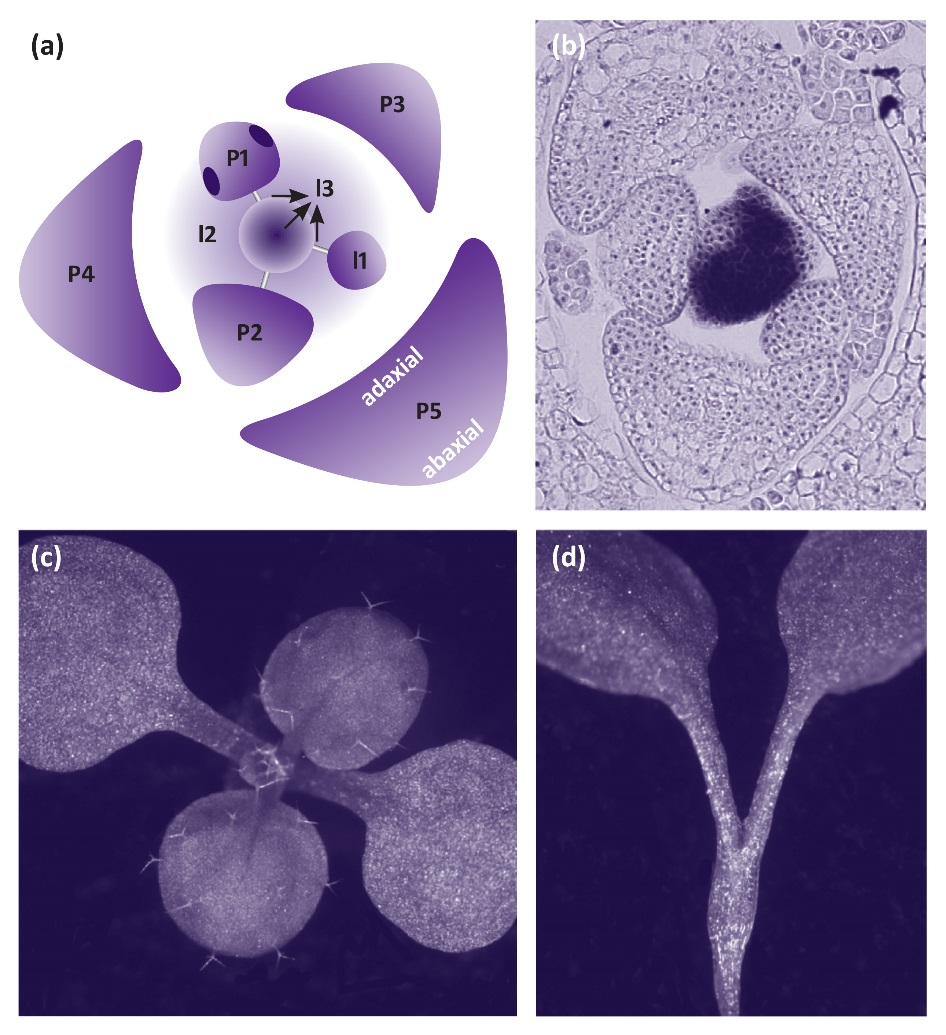
Figure 7.15 Leaf initiation and shape is determined by auxin and KNOX genes. (a) Diagram of the shoot apex with central meristem, incipient leaves I1-I3, and initiated leaves P1-P5. Arrows indicate the flow of auxin to the site where a new leaf will initiate. (b) in situ hybridisation showing expression of the class I KNOX gene SHOOT MERISTEMLESS in the shoot meristem and down-regulation in initiating and developing leaves. (c) Young Arabidopsis wild type seedling showing two cotyledons and first leaves. (d) The class I KNOX gene mutant shoot meristemless (stm) has 2 cotyledons and fails to produce leaves due to lack of a shoot meristem.
Each initiating leaf primordium is flanked by a boundary of slowly dividing cells and this boundary serves to delineate the leaf from the meristem and from adjacent leaf primordia. Several members of a transcription factor gene family known as CUP-SHAPED COTYLEDON (CUC) are expressed at this boundary and downregulation of CUC genes results in fusion of adjacent organs. This reflects the importance of the meristem-organ boundary in leaf development. As we see below, auxin, as well as the KNOX and CUC genes are also involved in determining leaf shape.
Following initiation leaf primordia go on to develop as discrete organs through cell division, cell expansion and cell differentiation. Leaf primordia become defined morphologically through cell divisions that lead to outgrowth from the meristem and hence formation of a proximal-distal axis. In the model species Arabidopsis thaliana (Arabidopsis), as the leaf grows a gradient of maturation occurs along this axis so that cells cease division and undergo terminal differentiation firstly in the distal region and lastly in the proximal region of the leaf. The leaf proximal-distal axis may have distinguishing features of lamina and petiole as in Arabidopsis and many dicotyledonous plants. One variation of this shape occurs in monocotyledons, which includes the grasses such as wheat, barley, rice and maize. Strap-like leaves of many monocotyledons have a distal blade and a proximal sheath, which wraps around the stem. The blade and sheath are separated by specialised cells that form a hinge, and this hinge allows the blade to bend away from the sheath and stem to be exposed to light.
The adaxial-abaxial axis is evident at early stages of development of the leaf primordium. The adaxial side of the leaf is the side nearest to the shoot meristem and the abaxial side is furthest from the meristem (see Figure 7.11 above). Experimental separation of initiating leaf primordia from the shoot meristem results in loss of adaxial fate. Amazingly this loss of adaxial fate leads to development of an abaxial, radial leaf. This indicates that adaxial fate is determined either by contact with the meristem, or by signalling from the meristem.
Most flat leaves have adaxial-abaxial polarity where the two sides of a leaf have distinct morphological features. On the leaf surface, adaxial and abaxial epidermal cell size and shape, stomata density, or the presence of elaborated cell types such as hairs may be different. Vasculature often has a discrete adaxial-abaxial polar arrangement with adaxial water-conducting xylem and abaxial nutrient-conducting phloem (Figure 7.16a). Internal mesophyll cells of the leaf may also display differential arrangement along the adaxial-abaxial axis. In some species, the adaxial domain has closely aligned and chloroplast-rich palisade mesophyll cells whereas the abaxial domain has dispersed spongy mesophyll cells. Mature leaves are typically oriented with the adaxial side facing the light and the abaxial side away from the light. As such, distinct cell types along the adaxial-abaxial axis serve to optimize light capture and gas exchange for photosynthesis.
On top of this layer of regulation, adaxial and abaxial fates are each determined by specific genes. A reduction in expression of genes required for either adaxial or abaxial fate results in development of leaves that comprise only the opposite fate. Furthermore these leaves are radial. Together such observations have led to a fundamental tenet of leaf development, whereby adjacent adaxial and abaxial tissue types are essential to development of an adaxial-abaxial axis and hence to formation of a flattened leaf.
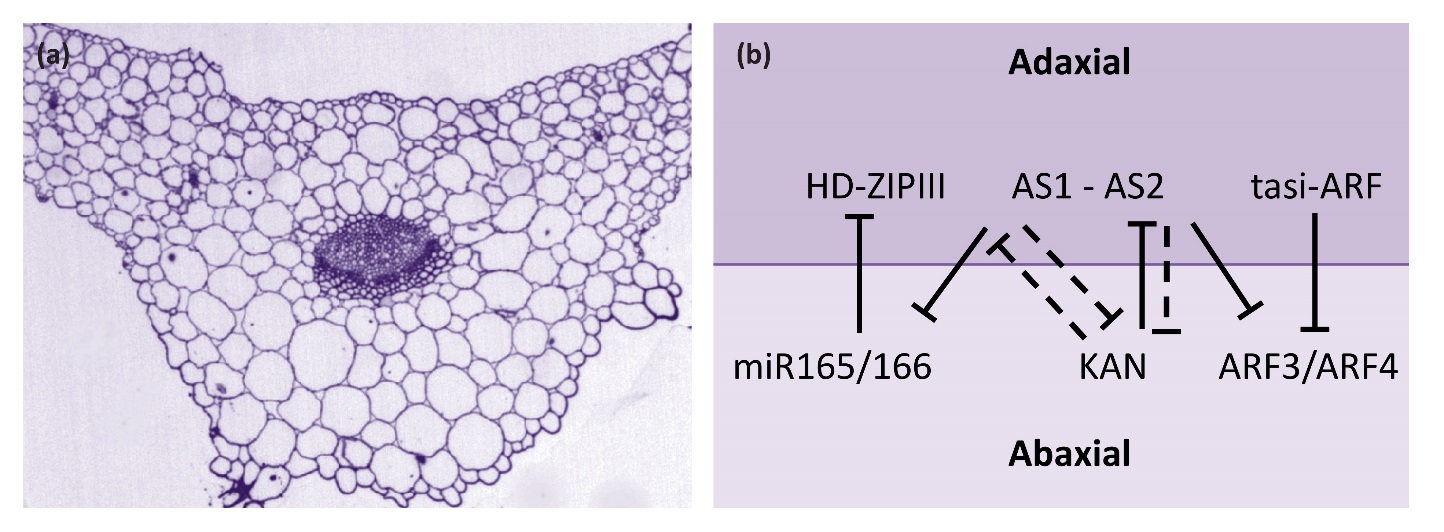
Figure 7.16 Leaf adaxial-abaxial fate. (a) Cross section through the mid-vein region of an Arabidopsis leaf. Tissues of the leaf including vasculature show distinct adaxial (upper surface) and abaxial (lower) differences. (b) Diagram showing adaxial and abaxial gene interactions. Solid lines indicate direct repression, dashed lines indicate indirect repression.
Key genetic determinants of adaxial fate include class III HD-ZIP transcription factors (Figure 7.16b). These proteins have a homeodomain, which is involved in binding DNA, a leucine zipper domain, which is involved in protein-protein interaction, and a sterol-binding domain that is predicted to bind small lipid molecules. In Arabidopsis, there are five genes encoding class III HD-ZIP transcription factors. Three of these genes, PHABULOSA (PHB), PHAVOLUTA (PHV) and REVOLUTA (REV), have a significant role in leaf development. Transcripts of all three genes are confined to the adaxial domain through transcriptional and post-transcriptional repression in the abaxial domain. For example, PHB, PHV and REV transcripts are all targets of the microRNAs miR165 and miR166, which are expressed on the abaxial side of the leaf. In mutants with reduced class III HD-ZIP activity adaxial fate diminishes. Conversely, gain of class III HD-ZIP expression in the abaxial domain results in conversion of the abaxial side of the leaf to adaxial fate.
Two other transcription factors, ASYMMETRIC LEAVES1 (AS1) and ASYMMETRIC LEAVES2 (AS2), form heterodimers and promote adaxial fate, in part through repression of miR165/166. Abaxial fate is promoted by additional factors, including KANADI (KAN) proteins, which are part of a plant-specific group of transcription factors. In Arabidopsis, four KAN genes have overlapping roles in leaf development. KANADI proteins are expressed on the abaxial side of the leaf and are necessary and sufficient for specifying the abaxial fate. It is also known that KAN1 directly represses AS2. Other abaxial factors are AUXIN RESPONSE FACTOR (ARF) proteins, which bind to promoter sequence elements in auxin responsive genes and regulate plant response to auxin. The two ARF genes, ARF3 and ARF4, are repressed on the adaxial side to the leaf by a set of small RNAs known as tasiR-ARF. The AS1-AS2 module directly represses ARF3. Thus the emerging picture is that repressive interactions between adaxial and abaxial genes helps to set up the adaxial-abaxial axis of the developing leaf (Figure 7.16).
The mediolateral axis of leaves extends from the margin to the mid-region of the leaf, which is characterised by the presence of the main vein or midrib. Most leaves are bilaterally symmetrical and the two halves of the leaf, from margin to midrib, form mirror images. Leaf width is determined by the degree of lateral expansion along this axis. However, the relationship between the leaf margin and the midrib depends on cell recruitment from the shoot meristem during the process of initiation. Leaves of dicots initiate from a limited region of the shoot meristem so that the margins arise from cells close to the mid-region and lateral expansion of the leaf occurs post-initiation. On the other hand, leaves of monocots such as grasses, recruit cells from around the entire circumference of the shoot meristem. In this case, the leaf margins are derived from cells that are distant from the mid-region and consequently this early lateral expansion results in the leaf primordium wrapping around the entire shoot meristem.
Relatively simple modifications of the basic leaf shape are achieved through changes in growth dynamics at the leaf margins. In this way, leaves can develop marginal teeth or serrations or may be lobed. Leaf shape is more dramatically modified in compound leaves, where the blade is divided into reiterating units or leaflets. Multiple orders of subdivision occur when leaflets themselves are further subdivided into leaflets, for example in the compound leaves of tomato, which may have primary and secondary leaflets. Surprisingly, studies on the simple, serrated leaf of Arabidopsis, the lobed leaf of the Arabidopsis close relative Cardamine hirsuta, and the compound leaf of tomato have found that genes involved in setting up leaf initiation from the shoot meristem also function to modify the shape of the leaf lamina. The class I KNOX genes are important for modified leaf shape in many species. These genes are not expressed in the simple leaf of Arabidopsis but are expressed in the lobed leaf of Cardamine and the compound tomato leaf. Misexpression of class I KNOX genes in Arabidopsis leaves generates lobed leaves and increasing expression of these genes in Cardamine and tomato results in more lobing or more leaflets. Likewise, decreasing class I KNOX gene levels in Cardamine leads to a more simple leaf shape. Thus the degree of leaf complexity can depend on the expression of growth promoting class I KNOX genes. In addition to KNOX genes, auxin and CUC genes play central role in elaboration of leaves. In compound leaves of tomato and lobed leaves of Cardamine, high levels of auxin occurs at discrete sites along the developing leaf margin, where leaflets or lobes will form. Furthermore CUC gene expression marks the boundaries between initiating leaflets. At these sites CUC genes act to repress growth thereby promoting separation of leaflets. Altering the spatial distribution of auxin or CUC in the young developing leaf leads to reduced leaflet production. Less intricate elaborations of leaf shape, such as leaf serrations, also involve auxin and CUC genes. In developing leaves of Arabidopsis, the margins form periodic auxin maxima flanked by boundaries of CUC gene expression (Figure 7.17).
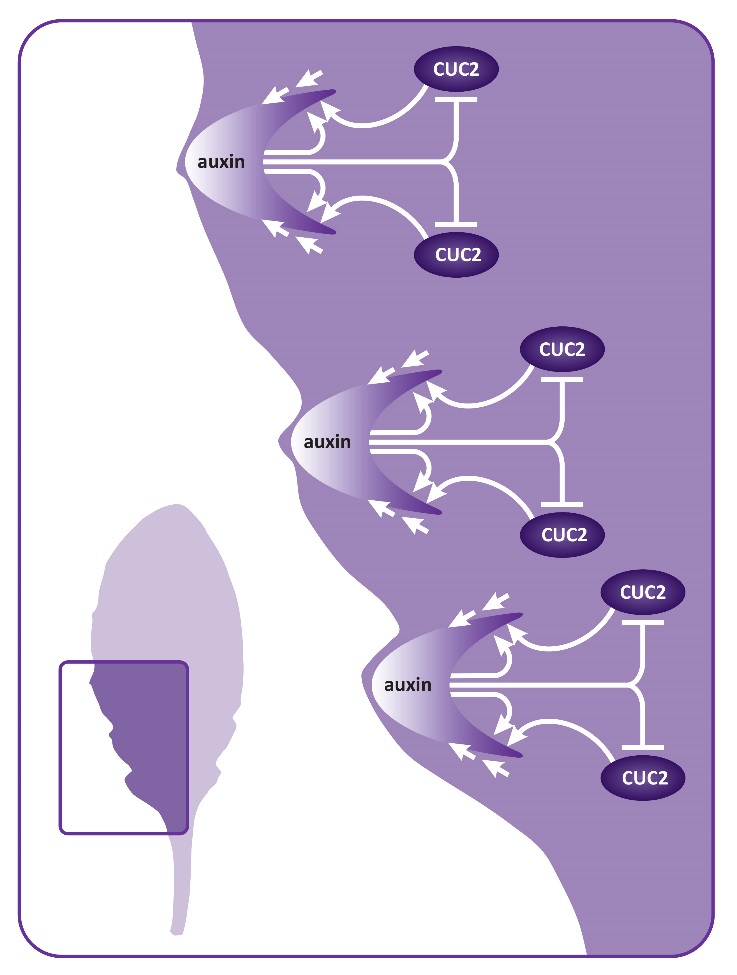
Figure 7.17 Modifying leaf margins. Serrations in Arabidopsis leaves occur at sites of auxin maxima. The PIN1 protein (straight arrows) promotes formation of an auxin peak. PIN1 is positively regulated by auxin and CUC2 (curved arrows). High levels of auxin in turn represses CUC2.
Bar M, Ori N (2015) Compound leaf development in model plant species. Curr Opin Plant Biol 23: 61-69
Bowman JL, Floyd SK (2008) Patterning and polarity in seed plant shoots. Ann Rev Plant Biol 59: 67-88
Braybrook SA, Kuhlemeier C (2010) How a plant builds leaves. Plant Cell 22: 1006-1018
Byrne ME (2005) Networks in leaf development. Curr Opin Plant Biol 8: 59-66
Byrne ME (2006) Shoot meristem function and leaf polarity: the role of class III HD-ZIP genes. PLoS Genet 2: e89
Chitwood DH, Nogueira FT, Howell MD et al. (2009) Pattern formation via small RNA mobility. Genes Dev 23: 549-554
Efroni I, Eshed Y, Lifschitz E (2010) Morphogenesis of simple and compound leaves: a critical review. Plant Cell 22: 1019-1032
Fukushima K, Hasebe M (2014) Adaxial-abaxial polarity: the developmental basis of leaf shape diversity. Genesis 52: 1-18
Hay A, Tsiantis M (2010) KNOX genes: versatile regulators of plant development and diversity. Develop 137: 3153-3165
Hepworth SR, Pautot VA (2015) Beyond the divide: Boundaries for patterning and stem cell regulation in plants. Front Plant Sci 6: 1052
Machida C, Nakagawa A, Kojima S et al. (2015) The complex of ASYMMETRIC LEAVES (AS) proteins plays a central role in antagonistic interactions of genes for leaf polarity specification in Arabidopsis. WIRES Develop Biol 4: 655-671
Mentink RA, Tsiantis M (2015) From limbs to leaves: common themes in evolutionary diversification of organ form. Front Genet 6: 284
Sluis A, Hake S (2015) Organogenesis in plants: initiation and elaboration of leaves. Trends Genet 31: 300-306.
B. E. S. Gunning, Research School of Biology, Australian National University
Cell walls determine most of the fundamental features of the Plant Kingdom.
More than one billion years ago certain key evolutionary events set the cells that were to become the progenitors of plants apart from the other primordial organisms. What were these defining attributes and what part did they play in founding the Plant Kingdom?
Some would say that photosynthesis was the key to plant evolution. It arose first in prokaryotes and later passed to eukaryotes. Certainly it was essential, but was it alone sufficient to trigger evolution towards the Plant Kingdom? The theme of this case study is that the full potential of photosynthesis could not be realised by the progenitors of plants until they had evolved a suitable cellular environment, of which a vital component is a cell wall. Photosynthesis still occurs in unwalled, evolutionary dead-ends like Euglena, reinforcing the view that a truly seminal cellular state was only achieved when photo-synthesis in a eukaryotic cell was combined with a cell wall. Consider now how cell walls confer unique features on plant cell organisation and function, and how they underpin the entire lifestyle and marvellous diversity of plants.
Why did the first eukaryotic, photosynthetic, walled cells have such distinctive evolutionary potential? Probably all life was aquatic at the time and regulating water and solute balance (osmotic regulation) was critical for survival. The earliest cells were almost certainly in osmotic balance with the fluid in which they lived. However, as cell metabolism became more complex, internal solute concentrations rose. If solute concentrations in the surrounding medium dropped (for example, if it rained), water would be taken up by cells to equalise the osmotic pressure and they would swell. Cells which do not have walls, like Amoeba, control swelling by expelling water, otherwise they would burst (Figure 1). A cell wall containing strong but flexible micro-fibrils offered the progenitors of the Plant Kingdom an alternative solution. Hydrostatic pressure created by water flow into cells is opposed by the mechanical strength of cell walls generating wall pressure. In living cells, this neatly balanced cell turgidity is maintained by control of osmotic processes, mechanisms for turgor sensing and organisation of cell wall composition.
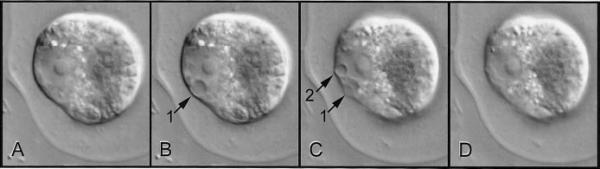
Figure 1 Contractile vacuoles filling and emptying in a Chlamydomonas cell. Four pictures were taken about two minutes apart to illustrate the filling and emptying cycle of two contractile vacuoles in the cell. A, The two contractile vacuoles are empty and invisible at this magnification. B, One vacuole has filled (arrow). C, This vacuole is emptying and the second vacuole is filling. D, Both vacuoles have emptied again. Part of the boundary of the gelatinous envelope that surrounds the cell is visible in each picture (Micrographs courtesy B.E.S. Gunning)
Most plants adjust the osmotic properties of their cells so that they can live in a turgid state regardless of the water potential in their environment. This brings great advantages for plants. The balance of forces in a turgid cell generates more than just water balance. It confers rigidity and mechanical strength, as witnessed by comparing a wilted leaf with a turgid leaf. Another way to gain strength is, of course, to synthesise thick cell walls. However, organs composed mainly of thin-walled cells, like leaves, can support themselves if they are turgid. They therefore do not need to synthesise the large amount of wall material that would be required if strength relied solely on wall rigidity. This is especially important in growing regions of plants where cells must enlarge. Primary cell walls also confer enough strength on tissues for them to hold their shape and form — for example, enough to let a root tip penetrate through soil. In general, as cells mature the plastic properties of their walls give way to increasing rigidity.
Here, then, at the dawn of the Plant Kingdom, was a new form of osmotic regulation with many inherent evolutionary possibilities. It proved to be a springboard for the appearance of other novel features of plant cell structure and function.
Many distinguishing features of plant cells relate to cell walls. Vacuoles, for example, are found in the vast majority of plant cells, but seldom in animals. They probably evolved from an original digestive (lysosomal) compartment, indeed they still have some digestive roles in plant cells. Now one of their main roles is to store osmotically active solutes, thus partnering cell walls in maintaining turgor. In so doing they have a huge impact on the architecture and size of plants. Their presence permits economical production of large cells in which a small amount of biosynthetically expensive cytoplasm is distributed as a thin film over a large surface area between the wall and vacuole(s). Large, turgid, vacuolate, walled cells are in turn economical building blocks for increasing body size. In fact some 90% of all increase in volume during plant growth comes from an enlarging vacuolar compartment and concomitant stretching of cell walls. This process transforms small, densely cytoplasmic, meristematic cells into mature, vacuolate cells.
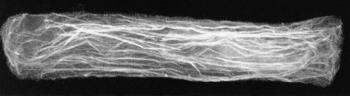
Figure 2 Microfilaments of actin. In this elongating cell from a wheat root tip, strands of actin ramify through the cytoplasm, mostly running along the length of the cell. They are stained here with a fluorescent antibody and viewed by confocal microscopy. The cell nucleus is just visible, lying in the right-hand end of the cell. Actin protein polymerises into microfilaments, and these often aggregate into bundles such as those imaged here. Polarity of the actin molecules determines the direction of cytoplasmic streaming along the microfilaments (Micrograph courtesy B.E.S. Gunning)
Walls and vacuoles together give the opportunity to make big cells and hence big plants, but this potential can be realised only if an associated metabolic problem is overcome. Thousands of biochemical reactions are needed to support life. For them to proceed fast enough the interacting molecules must collide sufficiently frequently. Simple diffusion in the confined volume of small cells allows them to do this — one of the advantages of being small. Frequency of collisions drops off greatly if the colliding molecules have to diffuse over longer distances, or are present in dilute solutions, as might happen in cells that have taken advantage of walls and vacuoles to enlarge dramatically. One way in which this potential physical limitation on life processes is alleviated in present-day plant cells is that a cytoskeletal system stirs and mixes the cytoplasm. The process is visible in most large walled cells and is fascinating to watch. Like stirring reactants in a beaker, it helps to overcome diffusion barriers.
Actin and tubulin are ubiquitous components of the cyto-skeleton of plants and animals. Actin molecules are the units of ‘microfilaments’ which provide tracks for cytoplasmic streaming (Figure 2). To achieve streaming, actin acts in concert with myosin (another cytoskeletal component), proteins and ATP as an energy source for mixing. Molecules of tubulin are polymerised to make ‘microtubules’, which have multifarious roles in living cells (Figure 3). Special roles related to cell wall development are discussed below.
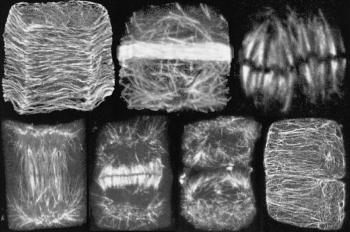
Figure 3 Microtubules have many roles during the cell division cycle. The following stages can be seen in cells from a wheat root tip stained with fluorescent-labelled antibody to the protein tubulin (from left to right): (i) pre-(or post-) division, when microtubules lie transverse to the long axis of a cortical cell, just under the plasma membrane. Microtubules govern congruent deposition of cellulose in the growing cell wall; (ii) the cell has become committed to divide and is establishing the future site and plane of division by laying down a dense band of microtubules (the ‘pre-prophase band’) that passes right around the cell; (iii) the metaphase stage of mitosis, with chromosomes lined up on the equator of the division figure, connected to poles of the mitotic spindle by bundles of microtubules that ultimately separate daughter chromosomes; (iv-v) early and later stages of development of the ‘phragmoplast’, an apparatus of microtubules and actin in which a new cell wall is initiated between the daughter nuclei; (vi) division almost complete, with just a few remnants of the phragmoplast visible and two daughter cells almost separated, although their cortical microtubules are not yet recognised; (vii) daughter cells have formed new arrays of cortical microtubules, similar to those of stage (i). (Based on Gunning and Steer 1996)
Plant cell walls comprise two phases: microfibrils (mainly of cellulose, the world’s most abundant biopolymer) are embedded in a gel matrix of other polysaccharides and some very specialised proteins. Two distinct sets of biosynthetic apparatus generate the microfibrils and the matrix components, bringing further unique features to plant cell organisation.
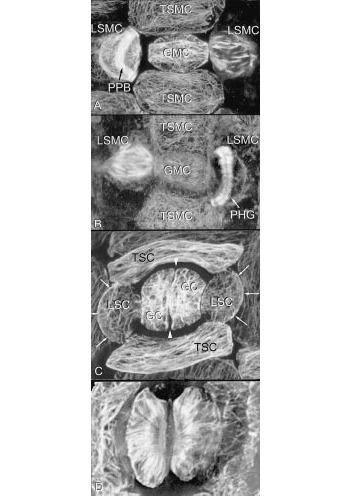
Figure 4 The basic types of microtubule array can vary greatly in specialised cells and tissues. Developing stomata show many complexities, including asymmetrical cell divisions and formation of cell walls with unusual microfibril reinforcement. Four stages of formation of Tradescantia stomata are shown here, using microtubule staining. In A, the central guard mother cell (GMC) is surrounded by terminal and lateral subsidiary mother cells (TSMC and LSMC); here the LSMC on the left has a curved pre-prophase band (PPB) which predicts the shape of the future wall of the subsidiary cell (arrows in C).The LSMC on the right is in mitosis. B, This shows a later stage, with the LSMC on the left in mitosis and that on the right with a curved phragmoplast (PHG), also predicting the shape and position of the future wall. C, Divisions are complete. Arrows show the walls that were formed successively under the influence of the pre—prophase band and phragmoplast. The guard mother cell seen in A and B has now divided longitudinally (between arrowheads) to form two guard cells (GC) in the stomata. All four subsidiary cells (two TSC and two LSC) have now been formed. During differentiation of guard cells, microtubules in the cell cortex radiate from the future pore (D). Cellulose microfibrils are deposited in this orientation, creating a cell wall that can respond to turgor changes in such a way that the stomatal pore can be opened and closed (Micrographs courtesy A. Cleary)
One biosynthetic apparatus consists of cellulose-producing enzyme complexes in the plasma membrane. They often work under the guidance of an array of microtubules that lies at the inner face of the plasma membrane and directs growing cellulose chains into specific orientations. This is a vital regulatory system because the strength of cell walls depends on the orientation of its microfibrils. The microtubule cytoskeleton lying beneath the plasma membrane is a tool by which cells control the local directional strength of their walls. Microtubule arrays indirectly determine the shape that a cell assumes when it is stretched by turgor (Figure 4). There is nothing like this combination of membrane-based synthesis and guidance by cytoskeletal microtubules in animal cells. In plants it is a major mechanism of cell shaping and lies at the heart of much of plant morphogenesis.
The second biosynthetic apparatus for wall production does have a counterpart in animals, but the flavour is different, thanks again to the wall itself. All eukaryotic cells have an elaborate system of membranes in which certain proteins are made, modified and secreted. Most of the proteins secreted by animal cells are glycoproteins, that is, proteins with carbo-hydrate side-chains attached to them. A special region of the membrane system, the Golgi apparatus, adds these side-chains. Plants also make glycoproteins, but the great bulk of their Golgi activity is given over to manufacturing cell wall matrix polysaccharides. This differing biosynthetic emphasis might account for differences in organisation of the Golgi apparatus in plants and animals. In animal cells, Golgi bodies are usually central, near the nucleus, whereas in plant cells they are widely dispersed in multifunctional ‘Golgi-stacks’ of membranes. After the wall matrix materials have been made, vesicles containing them are delivered from Golgi stacks to particular regions of the cell surface and thence to growing cell walls. Especially in large cells, this intracellular movement depends once again upon the actin-based cytoplasmic streaming system that evolved in walled cells.
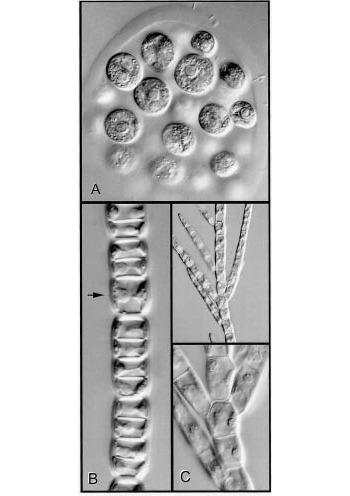
Figure 5 Cell walls, planes of cell division and the form of a plant body are illustrated in genera of green algae. A, Colony of Eudorina. The constituent cells are embedded in a gelatinous matrix. At the end of cell division daughter cells separate from one another. B, This shows what happens when division is always in one plane. Sharing of new cross-walls by daughter cells causes them to adhere to one another. The arrow indicates a cell that was about to divide. C, A vital new feature — the ability to change the plane of division generates branching systems of adherent cells (Stigeoclonium, low and high magnification views). (Micrographs courtesy B.E.S. Gunning)
Two elaborate cytoskeletal devices place new cell walls accurately (Figures 3 and 4). The first is a preparation for cell division. The cytoskeleton of the parent cell establishes the site and plane of division even before the nucleus undergoes mitosis. This cytoskeletal apparatus (pre-prophase band) is not found in present-day algae (although many algae can still control the plane of division in their cells) and may have arisen after the algal stage of plant evolution. A second cytoskeletal structure initiates the actual fabrication of new cell walls. It is initiated between daughter nuclei and grows outwards to join the parental walls at a predetermined site. This apparatus, termed a phragmoplast, did evolve in advanced algae and occurs in the ancestors of higher plants. Neither of these cytoskeletal devices for establishing and implementing precise sites and planes of cell division occurs in animals.
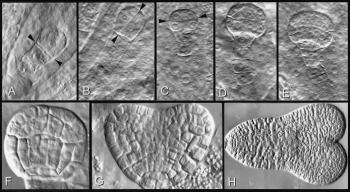
Figure 6 Cell walls, planes of cell division, and form of the plant body illustrated through embryogenesis in a higher plant. Embryo formation in Arabidopsis provides an example of highly regulated planes of cell division during formation of a specifically shaped plant body. Arrowheads in A to C show successive planes of division in very young pro-embyos. Subsequent divisions (D-H) build up a heart-shaped embryo with surface and inner walls and embryonic root and cotyledons. D, The complete suspensor filament as well as the globular pro-embryo. In A to E the embryos are embedded in endosperm tissue in the embryo sac; in F to H they have been isolated from their embryo sacs. (Based on Gunning and Steer 1996)
Cell wall properties have implications for plant nutrition. The close-knit fabric of cell walls sieves out all but very small nutrient molecules. This rules out a feeding mechanism that was probably common in early life forms — engulfing particles of food in loops of plasma membrane and internalising them for digestion. The first walled cells had to adapt their nutritional habits leading to at least two evolutionary outcomes. Present-day fungi subsist on external food sources by secreting enzymes that digest macromolecules sufficiently to allow the products to pass through cell walls. Roots of higher plants also secrete extracellular enzymes such as phosphatases which liberate inorganic phosphate. Higher plants also entered into an intra-cellular symbiosis with photosynthetic organisms, which then served as internal sources of organic carbon compounds. This led to green plants, whose present-day chloroplasts are held to be much-modified descendants of originally free-living photo-autotrophs. Symbiotic association between walled hosts and photosynthetic partners laid the foundations for a magnificent diversity of plant life, mentioned at the start of this case study.
Another adaptation of cell walls allowed early colonists of the land to develop division of labour between roots and shoots and rise to the airy heights of fields and forests. External cuticle layers, which reduce loss of water to the atmosphere, let cells of aerial parts survive provided that water could be delivered from plant organs in contact with external sources, mostly roots. Numerous other adaptations of wall structure occur, some related to mechanical strength or protection, and many to transport of water and nutrients.
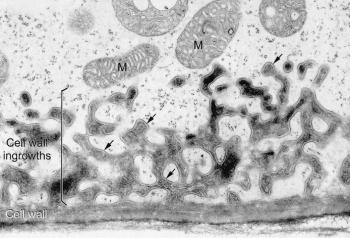
Figure 7 Transfer cell wall. Elaboration of a cell wall into projections that are lined by plasma membrane (arrows), thus providing an enhanced surface area for exchange of many different types of solutes. Transfer cells develop in various plant tissues involved in transport. Mitochondria (M) are usually found in the vicinity of the wall labyrinths (A. Browning and B.E.S. Gunning, freeze-substituted transfer cell in the haustorium of a Funaria sporophyte, based on Gunning and Steer 1996)
The molecular construction and small pore sizes of cell walls limit the size of molecules that can be transported around plant bodies. One pathway of transport consists of the interconnected lattice of cell walls themselves — the ‘apoplasm’. Impregnation of the wall matrix with hydrophobic substances creates apoplasmic barriers in some strategic locations; in other locations the apoplasm is open and permeable. In ‘transfer cells’, fingers of wall protrude into the cytoplasm and provide an unusually large surface area for transport across the adjacent plasma membrane (Figure 7). Many sites of intensive absorption or secretion possess this wall adaptation.
From the very early evolution of multicellular plants, fine cylindrical extensions of cytoplasm — plasmodesmata — have pierced the wall between adjacent cells. By passing through cell walls and the middle lamella, plasmodesmata form a transcellular commune of living cell contents known as the ‘symplasm’. Through this important cell to cell transport pathway, bounded by a continuous plasma membrane system, tissues evade some of the transport constraints imposed by cell walls.
Division of labour into roots, stems, leaves, meristems and other organs depends upon mass transport of metabolic products. Because solutes transported around plants must sometimes traverse cell walls, there can be no equivalent of the blood-stream of animals, which delivers macromolecules in a mass flow. Only small, wall-permeable molecules (e.g. sucrose and amino acids) are suited for mass transport in plants. In turn, the need to import and export these small molecules determines the nature of many biochemical pathways and physiological systems in plants.
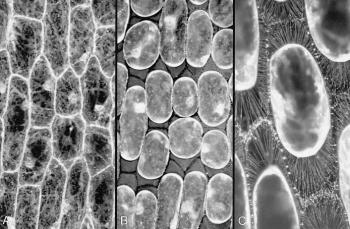
Figure 8 Connections between the plasma membrane and cell wall. A, Some cells in an onion bulb scale leaf epidermis, stained with the fluorescent dye DIOC(6) and viewed by confocal microscopy. Cytoplasm is seen as pale strands at the cell surface, traversing the large vacuole and often passing to the nucleus. Cell boundaries are bright because the surface cytoplasm (especially endoplasmic reticulum) is intensely fluorescent. B, Precisely the same field of view after plasmolysis in 0.6 M sucrose. The cell walls are now visible as dark lines between the shrunken protoplasts, which still show brightly fluorescent surfaces. C, A reconstruction of many planes of focus at a higher magnification to show some of the hundreds of stretched strands of plasma membrane that connect the protoplasts to the cell wall. These strands form because molecules in the plasma membrane (and peripheral cytoplasm) remain tethered to the wall during plasmolysis. The plasma membrane therefore becomes pulled out into very fine strands when the protoplasts shrink. (A and B are based on Gunning and Steer 1996; C, micrograph courtesy B.E.S. Gunning)
Plasma membranes and cell walls meet at a very special interface: a living cell abuts a non-living but chemically active external covering. Here the cell perceives much about the outside world. Innumerable connections between the inner face of the wall and the outer face of the plasma membrane are revealed by plasmolysis (Figure 8). These fine strands are indicative of molecules that link walls to plasma membranes. In some places links extend even further, connecting the wall through the plasma membrane to strands of endoplasmic reticulum and perhaps to elements of the cytoskeleton. These strands are ideally located to transmit physical signals arising from mechanical disturbance at the wall–membrane interface. Wall pressure in expanding, turgid cells might be communicated via these strands to activate membrane processes such as mechanosensitive channels.
Classical plant biology points to roles for a linked wall–membrane sensory apparatus. Charles Darwin showed that bean roots are 100 times more sensitive to touch than human touch receptors. Stimuli that he himself could not perceive alter root growth patterns. Plants respond dramatically to touch and to stretching and compression of cell surfaces. ‘Wind pruning’ of trees is a familiar example of a large-scale effect. Specialised touch receptors occur in tendrils and insectivorous plants. They also trigger mechanical pollination mechanisms. All such stimuli are perceived at the outer face of a cell wall, whence signals pass to and are transduced in the underlying cytoplasm.
Another class of wall-mediated sensing deals with chemical rather than physical stimuli. Plant cells detect certain short chains of sugar residues (oligosaccharides), derived from enzymatic hydrolysis of cell wall polysaccharides, with extraordinary sensitivity and specificity. This gives plants early warning of attack by pathogens, which normally have to digest their way through the cell wall as they begin their infection, liberating oligosaccharide signal molecules as they penetrate. Some of the plant’s own hormonal signalling system probably also uses oligosaccharides, independent of pathogen attack. In other words, the wall contains messages built into its molecular construction, ready to trigger growth or defence responses when released. More than most other phenomena, this illustrates the subtlety with which the cell wall is integrated into the life of plants.
Many constituent molecules give rise to hundreds of different wall polymers with diverse functions. Classical staining reactions to identify wall components are giving way to new approaches to wall function. Molecular probes such as antibodies and separation techniques give deeper insights into the great diversity and specificity of wall composition. Polysaccharides, for example, can be extraordinarily complex with wide-ranging variation in constituent sugar units, branching patterns, sequences and substituents. They can thus be extraordinarily specific in signalling and recognition systems.
Part of the chemical diversity of cell walls is related to functional diversity of cell walls in varied roles such as skeletal support, waterproofing, deterring herbivores, sustaining tension in the transpiration stream, protection of specialised cells like pollen grains from desiccation, and so on. Increasingly, however, very subtle chemical modifications of walls are viewed as ways in which cells can recognise each other and their positions in tissues and organs. There is now an appreciation of the role of chemical signalling as a guide to cell fate in plants, analogous to cell signalling systems in animals.
Cell walls impose a sedentary lifestyle on plants. With few exceptions, mobility of plants is limited to local movements of plant parts, explorations of the environment by growth of individuals and colonisation by reproductive units. Inevitable outcomes of being rooted to the spot include intense neighbourhood competition below ground for water and nutrients and above ground for light, adaptations to varied environments, subtle environmental sensing mechanisms, amazingly diverse chemical, physical and sacrificial defence strategies, breeding systems that employ mobile organisms to disperse propagules, and a type of cell wall that protects the only really mobile cell category, pollen grains, during their aerial journey. Events at all levels in plant biology are influenced by this sedentary lifestyle. That the habit comes from the evolutionary decision to regulate osmotic properties by means of a cell wall is not always explicit, but the underlying fact is there!
Strictly, cell walls are not alive but to dismiss them as an inert and uninteresting box around cells could not be further from the truth. Cell walls are the major determinant of plant form and function, whether viewed at the level of individual cells, whole-plant physiology or characteristics of the Plant Kingdom.
Not surprisingly, cell walls are one of the main foci of modern research in plant science. Their chemical complexity demands new techniques for separation, purification and analysis of their constituents, as well as studies of how the molecules interact and cross-link in the intact wall. Such knowledge is needed to understand how cells grow and recognise each other. Advanced computing is being added to biochemistry and biophysics in efforts to unravel the ‘micro-engineering’ properties of walls, necessary for looking at larger aspects of growth, for instance in shoot meristems where sheets of cells stretch, deform and grow out into leaf primordia. Increasingly the powerful methods of molecular genetics are being brought to bear. Already many mutants have been isolated with specific deficiencies in wall components, leading in turn to abnormal behaviours in growth, development and physiology. The research spectrum stretches from basic science to practical applications, the latter stemming from uses of cell walls in fibre, paper, fabrication, fuel and chemical industries. As usual, for the practical applications to prosper, plant scientists must learn much more about the basic biology — we must ‘first know the nature of things’.
Gunning BES, Steer MW (1996). Plant Cell Biology. Jones and Bartlett, Melbourne.
Gerd Bossinger and Antanas V. Spokevicius, School of Ecosystem and Forest Sciences, University of Melbourne
At the end of the first growing season, the stems of perennial plants consist of a parenchymatous pith in the centre of the stem surrounded by primary vascular tissue within a cortex of parenchyma, collenchyma and sclerenchyma cells, surrounded by an epidermis. The vascular tissue, consisting of xylem towards the inside of the stem and phloem to the outside, appears either as discrete vascular bundles (Figure 7.18a), for example as in Arabidopsis thaliana, or as a continuous hollow cylinder as in eucalypts. In either case, both phloem and xylem cells derive from a layer of meristematic cells forming the fascicular cambium which at the end of primary growth join up with meristematic cells between individual bundles, the inter-fascicular cambium, to form a complete meristematic cylinder, the vascular cambium.
At this stage, the primary root consists of a central column of xylem surrounded by a number of phloem strands formed and separated by procambium tissue. This vascular tissue is contained within a central cylinder that is enclosed by a pericycle and an endodermis, surrounded by primary bark and an epidermis (Figure 7.18b).
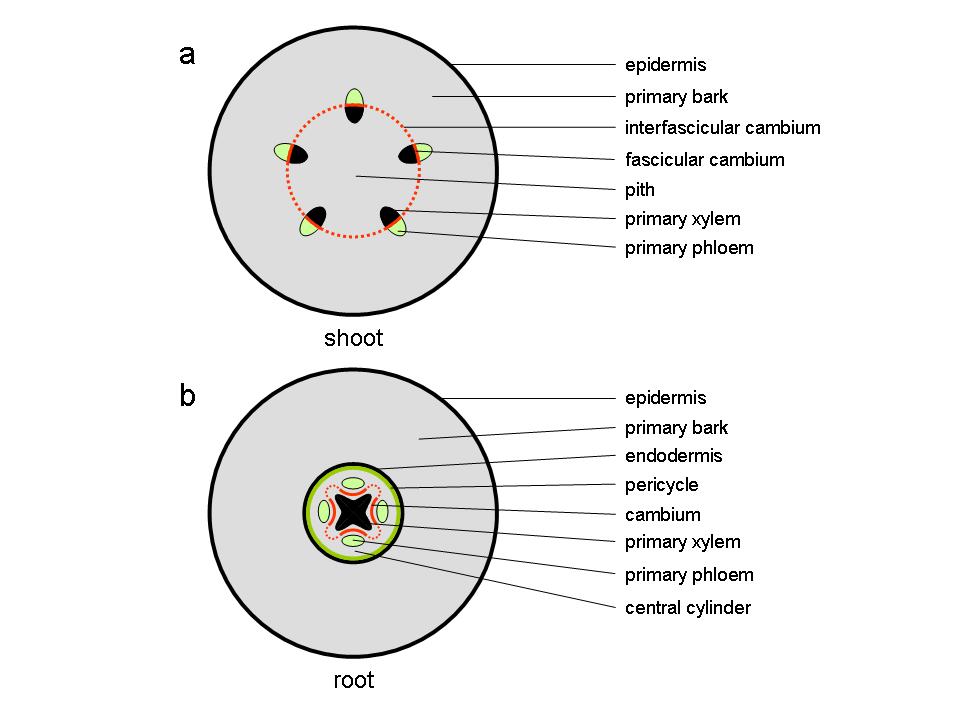
Figure 7.18 Diagram of transverse sections through stem and root at the end of primary growth. (a) dicot stem (b) root.
How did this develop? And how does cambial growth proceed to form the secondary stem tissues, wood to the inside of the stem and bark to the outside?
The procambium forms early during primary growth (in fact as early as the formation of a heart shaped embryo) and, after germination, it can be found in leaf and primary stem tissue. In the embryos of most dicotyledonous plants, the procambium is established from the differentiation of ground meristematic tissue in the hypocotyl and, as the embryo develops cotyledons, the procambium begins its activity by undergoing acropetal (from the base towards the top) divisions toward the shoot apex. After germination has been initiated and leaf formation begins, the procambium starts to develop further and becomes visible as cell bundles from leaf traces formed below the shoot apex. The procambium then begins to advance acropetally toward the newly derived cells below the shoot apical meristem and, basipetally to connect with the vascular tissue in lower, more mature parts of the stem. As the pro-cambial strands mature a lateral initiating or meristematic layer develops, the fascicular cambium (Figure 7.18a). Cells in this region undergo substantial longitudinal elongation prior to completing their development. While interfascicular cambium differentiation is not fully understood some evidence suggests that it forms between distinct vascular bundles from cells predetermined early in development, which under hormonal control re-differentiate to become meristematic.
Auxin is basipetally transported from leaf primordia to the shoot apex and is believed to be the major factor involved in the process of vasculature patterning and differentiation. The initiation of fascicular and interfascicular cambia is believed to be controlled by different and distinct mechanisms. For example, diffusion of auxin in the form of indole-3-acetic acid is involved in the initiation of meristematic activity and vascular tissue differentiation in the interfascicular region of Arabidopsis thaliana. At the molecular level, a mutation in a Class III homeodomain-leucine zipper (HD-ZIP) gene named INTERFASICULAR FIBERLESS (IFL1) leads to the loss of extra xylary fibre cell formation in the interfascicular region but does not have an effect on vascular bundle formation. This gene is expressed preferentially in the interfascicular region and acts as a transcription factor affecting the polar transport of auxin.
In the root, the cambium develops first from procambial tissue in the grooves between the star-shaped primary xylem and individual primary phloem strands (Figure 7.18b). Soon after, pericycle cells opposite the xylem protrusions divide periclinally (the plane of cell division runs parallel to the surface) and the centripetally (towards the inside) derived daughter cells become part of the cambium, now separating primary xylem from primary phloem.
The cambial cells opposite the primary phloem strands begin to produce secondary xylem transforming the star-shaped cambium into a cambial cylinder gradually producing secondary xylem and phloem around its entire circumference.
The cambial zone includes a tier of meristematic cells between the developing wood (xylem) towards the inside of the stem and bark (phloem) tissue towards the outside (Figure 7.19). Cell divisions in this region either occur in parallel to the stem axis (periclinal) adding cells to a radial file of cells, or perpendicular to the stem axis (anticlinal) adding new cells to the initiating layer and thereby allowing for the establishment of new radial files. The cambium proper is formed by a layer or layers of initiating cells (cambial initials) that undergo mostly periclinal, but also anticlinal division to give rise to radially aligned files of secondary tissue. These initials are enclosed on both radial walls by xylem and phloem mother cells, respectively. Mother cells have a higher differentiation state than initials as they are destined to become either xylem or phloem elements, whereas true cambial initials retain the ability to produce both. Xylem and phloem mother cell divisions make up the majority of periclinal divisions in this zone and cambial initials replenish mother cells when those are lost from the cambial zone. Most anticlinal divisions are contributed by cambial initials resulting in the formation of new radial files and supporting the increase in girth of the growing tree stem.
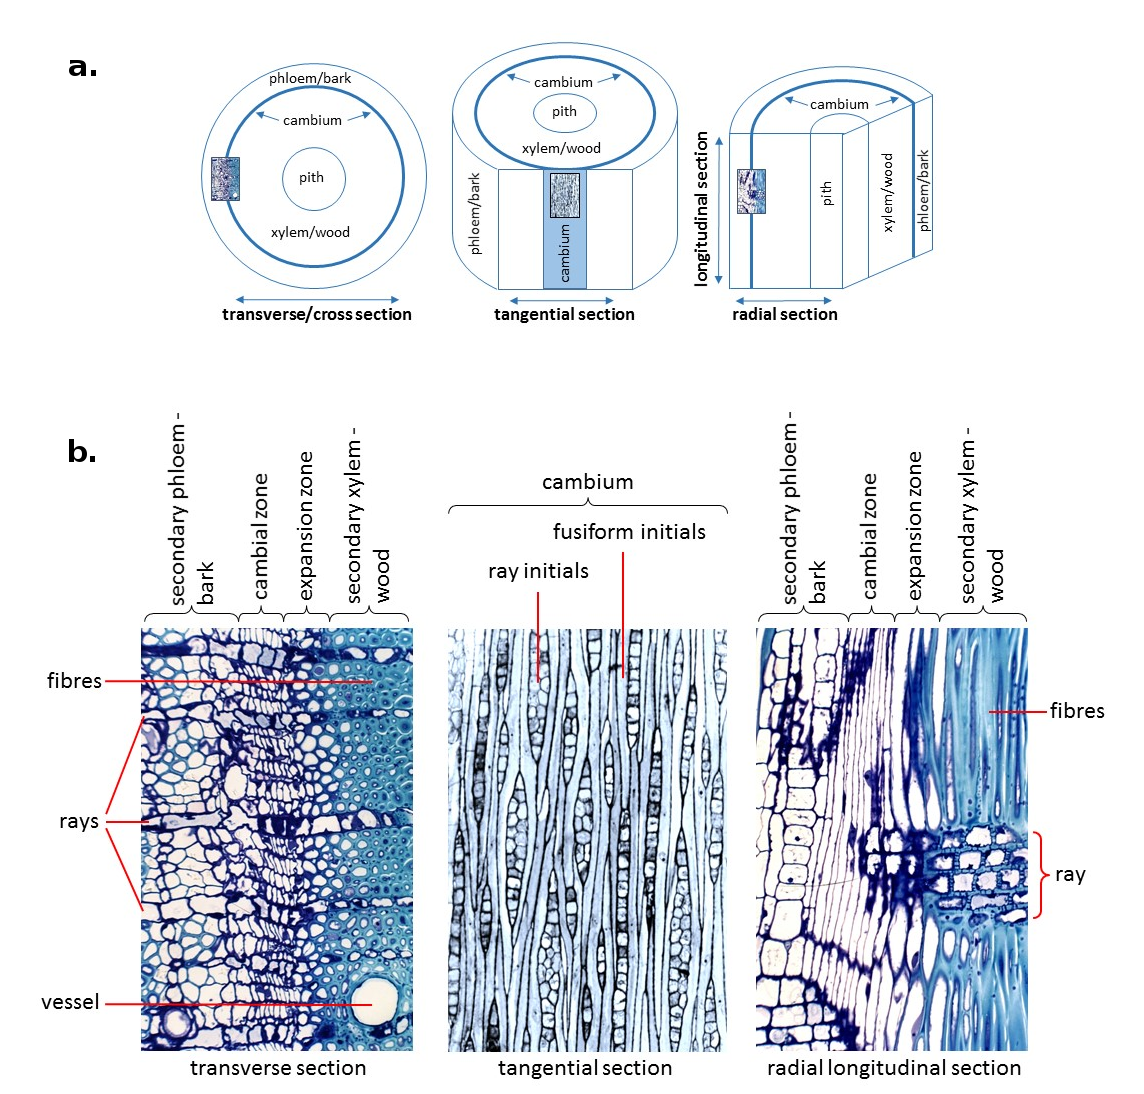
Figure 7.19 The cambial zone in mature Eucalyptus nitens stems. (a) Diagrams comparing planes of sectioning through an angiosperm tree stem. (b) Sections through the cambial zone of Eucalyptus nitens showing relevant structures and cell types. (Photomicrographs courtesy L. Wilson)
Meristematic cells in the cambium include fusiform initials and ray cell initials, which are responsible for the formation of specific cell types in both xylem and phloem tissues (Figure 7.19b). Fusiform initials give rise to longitudinally aligned cells including vessels, tracheids and fibres towards the inside of the stem (in gymnosperms only tracheids are formed) and sieve tube elements towards the outside. They are large (compared to ray initials), longitudinally elongated and highly vacuolated. Ray initials on the other hand give rise to transversely aligned cells, primarily ray parenchyma cells, and occur as scattered aggregations within the cambial zone. The ratio of fusiform to ray initials can vary within the cambial zone depending on plant species, age, environmental factors and growth rates. For example, in angiosperms, fusiform initials on average make up 60-90% of the initials within the cambium. While in some species the cambium is comprised entirely of fusiform initials in others they make up as little as 25%.
Fusiform initials in the cambium occur either in a storied arrangement, where cells are laterally aligned, or non-storied, where they are arranged irregularly and often overlap. Divisions in a storied cambium generally occur synchronously resulting in lateral alignment and are typical of some small woody plant species, whereas divisions in a non-storied cambium occur asynchronously and are typical in trees. A storied cambium is believed to represent a more advanced evolutionary arrangement. Fusiform cell derivatives undergo variable amounts of cell expansion during differentiation with radial width often doubling and longitudinal length remaining more or less similar except for some longitudinal extension at the tip (expansion zone in Figure 7.19b). Longitudinal extension, particularly in xylary elements, occurs in the form of intrusive (or sliding growth) which involves the extension of tapered end walls of derivatives into the available space around them. Consequently, the end walls intertwine with end walls of other cells forming strong bonds that increase the mechanical strength of the stem.
The arrangement of rays in angiosperms is highly variable and can be uniseriate (1 cell wide), biseriate (2 cells wide) or multiseriate (3 or more cells wide) while in gymnosperms rays are exclusively uniseriate. Ray initials do not undergo much elongation during differentiation and have been observed to unite frequently, both vertically and laterally to form aggregate rays as well as to split by cell invasion of fusiform initials. The size of ray initials tends to remain constant throughout the life of the plant but their derivatives show a gradual increase in size with age and distance from the pith. Trans-differentiation from a fusiform initial to ray initials can occur in the cambium to maintain a balance between derivatives. This takes place either by segmentation or by progressive shortening of a fusiform initial, whilst trans-differentiation from a ray to a fusiform initial involves elongation via intrusive growth. The mechanisms that drive this process are largely unknown but proximity to other ray initials as well as the effects of plant hormones such as auxin and ethylene have been suggested.
Further differentiation of cambial cells results in the formation of vascular tissues, which are involved mainly in longitudinal transport of liquids and solutes up and down the plant stem. This is facilitated by the creation of long, unbroken tubular structures. Vascular tissue is made up of two distinct elements, xylem and phloem, with xylem being involved in the transport of water, soil derived nutrients and plant hormones from the roots up to the shoots, and phloem in the transport of organic material such as photosynthetic products, proteins, hormones and other regulatory molecules from the leaves to the roots. During secondary growth, these tissues, in particular xylem, are also involved in providing mechanical strength to the stem and as a storage sink for metabolites produced in other parts of the plant. Production of these conduits from the cambium is polarised with xylem derivatives produced centripetally (toward the inside of the meristematic layer) and phloem derivatives centrifugally (toward the outside of the meristematic layer).
Secondary vascular tissue, produced by fusiform initials in the cambium consists of axially aligned tracheary elements (fibres, tracheids, vessels) involved in xylem transport and axially aligned sieve elements (sieve tube cells, companion cells) involved in phloem transport. Ray and axial parenchyma cells are also products of meristematic activity in the cambium and occur in both xylem and phloem tissues. Ray parenchyma cells are aligned radially and axial parenchyma cells are aligned longitudinally. Both parenchyma tissues are involved in transport and storage.
In angiosperms longitudinal transport in the xylem occurs in vessels, which are specialised for liquid transport and arranged end on end to form a continuous, longitudinally aligned tube system. Vessel elements exhibit tapered end walls and thickened lignified cell walls. Prior to maturation and becoming functional, vessel elements undergo programmed cell death (PCD), a process during which cellular content is actively removed, which together with specialised end structures known as perforation plates allows for unimpeded flow between individual vessel elements. Vessels do not form completely straight parallel tubes but rather deviate from their axial path slightly to come in contact with other vessels creating a network of interconnected tubes that allow for movement between vessels through cell wall pits.Vessels are surrounded by longitudinally aligned fibre cells which have a role in providing strength to the plant stem. Compared to vessels, fibres are longer and narrower, have thicker, usually more heavily lignified cell walls, increased tapering of their end walls and they lack a perforation plate. Fibres also undergo PCD as they mature and contain simple pits on their cell walls that allow for minimal transport of liquids between adjacent fibres. Fibres are found most frequently in the xylem and, to a lesser extent, in the phloem where they are arranged in small bundles. In gymnosperms, both transport and strength are provided by a single xylary cell type, tracheids, which, in terms of morphology, are an intermediate form between a fibre and a vessel element. Tracheids are also found in angiosperm stems but to a much lesser degree. Transport of liquids between tracheids is via specialised cell wall openings called bordered pits which through passive opening or closing via acentral, thickened area of pit membrane (torus)can prevent gas or water movement (for example to prevent possible embolism).
Parenchyma cells are rectangular to almost isodiametric in shape and alive at maturity. They are involved in a variety of roles such as transport, signaling, storage and wound responses. Walls of parenchyma cells have a characteristically high number of plasmodesmata that allow for efficient cell to cell communication and transport. Ray parenchyma cells are the only cells within a tree stem that are aligned radially and play an important role in transport and communication between xylem derivatives, cambial initials and phloem derivatives. Similarly, axial parenchyma cells are the only live cells aligned longitudinally in the xylem. They are important for storage and transport in this direction while in the phloem they more often fulfill a storage function.
In the phloem, longitudinal transport occurs via sieve tube elements, which like vessels, are aligned end to end and form continuous tubes. Individual elements are connected by structures called sieve plates. Sieve tube elements undergo some elongation and cell wall thickening during differentiation but differ from vessels and fibres as they do not undergo lignification. Also sieve tube elements are alive at maturity and have adapted a highly modified cytoplasm to allow for free movement of solutes between cells. Here, so called P-proteins internally line all sieve tubes and in the event of wounding can seal sieve plates and allow for wound closure. Cytoplasmic modifications occur via the removal of large organelles including the nucleus, ribosomes, golgi bodies, the tonoplast (vacuoles) and a cytoskeleton as well as links of plasma membranes between longitudinally aligned cells. Sieve tube elements form an association with companion cells, which in angiosperms are derived from a single division of a sieve tube element during differentiation while in gymnosperms they are derived from separate lineages. Companion cells are believed to produce and secrete information molecules via plasmodesmata to associated sieve tube elements.
The most prominent cell division type in the cambial zone, making up approximately 90% of divisions in the cambial zone, is periclinal or additive division, which leads to the formation of highly organised files of radially aligned cells. Unlike in most cell divisions in plants where the cell plate forms across the shortest distance of the cell, cells undergoing periclinal division in the cambium have a cell plate that forms across its long axis. In this process the cell plate begins formation around the mid point of the cell and develops longitudinally until it connects with two lateral cell walls at the end of a cell, resulting in the formation of two nearly identically sized daughter cells. Anticlinal divisions or multiplicative divisions do not occur as frequently as periclinal divisions and are responsible for the formation of new radial files within the cambial zone capable of further periclinal divisions. Anticlinal divisions account for the increasing stem circumference as a result of radial growth as cell wall expansion of initials and their derivatives is not sufficient to compensate for this. This results in a higher frequency of anticlinal divisions during times of accelerated plant growth. The number of anticlinal divisions occurring in fusiform initials is often higher than the number required to compensate for an increase in stem circumference. Superfluous cells are either lost or squeezed out from the cambial zone or undergo trans-differentiation to form ray initials.
Wood formation (xylogenesis) comprises cell division, cell expansion, secondary cell wall deposition, lignification and finally programmed cell death, which occur in highly coordinated and defined ways in response to the environmental conditions imposed on the plant. In mature tree stems, fusiform cambial initials give rise to fibres, tracheids and vessel cells (only tracheids are formed in conifers) while ray cell initials give rise to ray parenchyma cells which, combined, form the ray system. Following division, but prior to the commencement of secondary cell wall deposition, the immediate xylogenic derivatives of fusiform cambial initials (i.e. xylem mother cells) undergo cellular expansion to reach their final form. The extent of this turgor driven expansion is regulated by a range of enzymes that assist in the association and disassociation of primary cell wall components including pectin, randomly aligned cellulose microfibrils (MF) and other non-cellulosic polysaccharides.
The beginning of secondary cell wall formation marks the end of cellular expansion with the production of new cell wall layers leading to cell wall thickening. This stage is characterised by the deposition of large amounts of aligned cellulose microfibrils to the inside of the primary wall in three layers, S1, S2, S3. These differ in their thickness and cellulose MF alignment, and also by the development of cell wall pits. The S2 layer is the most dominant of these layers, accounting for approximately 75-85% of the cellulose content in the secondary cell wall, and as far as wood properties are concerned, has the largest influence. For example ‘Microfibril Angle’ (MFA), one of the most important complex wood quality traits, refers specifically to the cellulose microfibril orientation in this layer of the fibre (or tracheid) cell wall. MFA is known to influence the stiffness and elasticity of individual cells as well as wood and wood products. During this process, the cell wall lignifies and finally undergoes programmed cell death (PCD) during which all cellular content is lost through the action of proteolytic enzymes.
In many tree species, a final developmental process, heartwood formation, occurs later during development. With progressing age, and with the continuous differentiation of some fusiform cambial initials into new vessels, older vessels towards the center of angiosperm tree stems no longer transport water and nutrients and the actively conducting sapwood develops into heartwood. The only cells that are still alive in the sapwood/heartwood transition zone are ray parenchyma cells. Here, they are believed to undergo programmed cell death, translocating polyphenolic substances into surrounding cell walls, leading to the discoloration of heartwood. Where ray cells of some angiosperm trees are directly associated with larger vessels, as a final developmental process, they can produce tylose plugs, decreasing wood permeability and preventing microorganisms from entering the center of the stem. A similar process occurs in sapwood in response to wounding in order to avoid embolism (Figure 7.20).
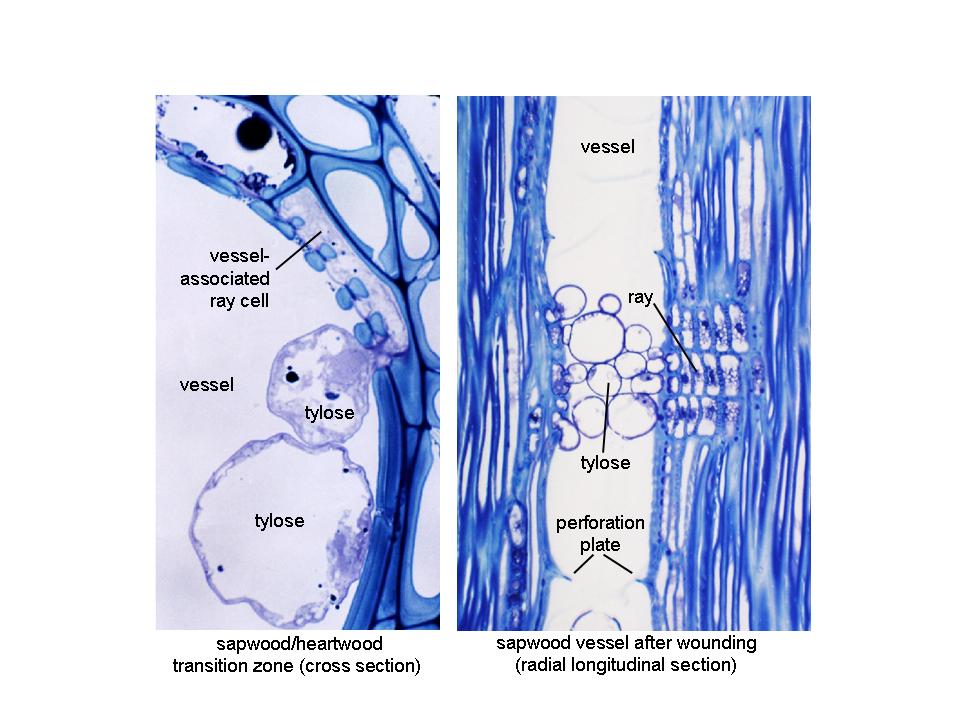
Figure 7.20 Tylose formation in mature Eucalyptus nitens stems (photos and microscopy by Dr Lawrie Wilson). Left: In the sapwood/heartwood transition zone, tylose plugs are formed by vessel-associated ray parenchyma cells, growing through pit pairs into the vessel lumen, eventually blocking them off from the transpiration stream. Right: Tylose plugs can also form in sapwood vessels in response to wounding. Here, disconnection of an affected vessel from the transpiration stream prevents air from entering the system and cause embolism.
The deposition of lignified secondary cell walls marks the end of cellular expansion and is central to the process of xylogenesis and ultimately determines the functional properties of wood. Secondary cell walls consist of cellulose, lignin and other non-cellulosic polysaccharides which typically represent 90% of the wood dry weight and provide support for the cell. Other minor yet important contributions to cell wall structure and function are made by cell wall proteins and other compounds. Quantitative and qualitative changes in the composition of these elements can lead to changes in cell wall properties and are responsible for the large variation in wood properties observed within and between tree species.
Throughout the year, the cambium undergoes cyclic or induced dormancy and activity periods and wood properties show high levels of variability in response to seasonal, developmental, genetic and abiotic processes. In temperate regions, typically in the northern hemisphere, the vascular cambium undergoes seasonal or periodic dormancy in response to unfavorable and/or detrimental environmental conditions. This dormancy period is usually triggered by a decrease in photoperiod, temperature and water availability during the autumn months preparing the plant for adverse winter conditions and in deciduous plants is closely linked with leaf shed. Prior to the onset of dormancy as conditions begin to decline, cambial activity as well as the number of dividing cells is reduced and cell wall thickness in fusiform initial derivatives in the differentiation zone increases. These seasonal differences in the formation of woody tissues enable the distinction between earlywood (larger cell lumen and thinner cell walls) and latewood (smaller cell lumen, thicker cell walls) leading to the creation of growth rings. Ray initial derivatives on the other hand do not undergo such strong seasonal changes in morphology but their number in the cambial zone decreases during dormancy. Changes in wood properties are also observed between wood produced from early stem growth, juvenile wood, and wood produced later from an older cambium, mature wood. Abiotic stress can lead to reaction wood formation (for example in response to non-vertical growth; referred to as tension wood in angiosperms and compression wood in gymnosperms) displaying altered secondary cell wall characteristics and wood properties to ‘normal’ wood in an attempt by new cambial growth to realign the stem back to a vertical position.
As the plant stem increases in girth during secondary growth, the outermost protective layer of the stem, the epidermis, is gradually shed and replaced by a periderm. Peridermal tissue is produced by the cork cambium (or phellogen) which, like the vascular cambium, comprises a meristematic layer that produces derivatives, both centrifugally and centripetally, and undergoes periclinal and anticlinal division forming radial files of cells. Derivatives from the phellogen differ from those of the cambium both structurally and functionally and the rate of division from this meristem is often much lower than that observed in the vascular cambium. The periderm is comprised of three different tissue types; 1) the phellogen or cork cambium, the meristematic tissue of the periderm, 2) phellum or cork, the outermost protective layer of tissue, and 3) phelloderm, the living parenchyma formed toward the inside of the phellogen. The phellogen is made up of a single layer or tier of cells that are radially flattened, rectangular to polygonal in shape, with thin primary walls, dense cytoplasm and, in some cases, chloroplasts. Phellum cells divide centrifugally from the phellogen and are highly specialised, creating an imperious barrier to gases and liquids on the plant stem. Phellum cells are usually polyhedral in shape, but can be radially compressed and/or elongated in several planes (radial, tangential and longitudinal) and are arranged compactly, lacking intercellular spaces. Phellum cells develop a layer of suberin, an unsaturated fatty acid that impregnates the cell wall during development and gives them their impervious properties. Maturation of these cells ultimately results in cell death. In some genera, e.g. Eucalyptus, phellum cells can also be lignified. Phelloderm cells are living parenchyma cells that divide centripetally from the phellogen and are similar in appearance to the adjacent cortical tissue, being only distinguishable by their radial alignment with cells in the phellogen.
The periderm is continuously replaced during growth and the site and tissue type from which it develops differ between species. Initiation of a periderm occurs either uniformly as a ring around the plant, or in scattered groups which link up later via lateral spreading.
Once the first periderm is ruptured, initiation of the next periderm usually occurs from either cortical tissue or phloem parenchyma whereas later periderms form exclusively from phloem parenchyma. This process is repeated continuously during the life of the plant. The formation of a new periderm displaces a large number of cells, which die and are shed from the stem, thus a tree continues to increase in diameter.
A.V. Spokevicius and G. Bossinger, School of Ecosystem and Forest Sciences, University of Melbourne
Trees are often big and difficult to work with. They have long generation times and many of the developmentally and commercially interesting characteristics, such as mature wood traits, are not observed until a tree is many years old. As a consequence, many aspects of the wood formation process remain elusive, such as the molecular control of wood formation and wood chemistry, which are commercially relevant. Much of our current knowledge about plant function and development has derived from the study of mutant and transgenic plants. In the absence of well-defined mutants, the functional analysis of many xylogenesis-related genes (responsible for wood formation) in forest tree species largely relies on transgenic approaches (Spokevicius et al., 2007b).
Many wood traits are extremely variable: most are influenced by programmed development (e.g. maturation of sapwood) and a range of environmental factors such as seasonal conditions which are expressed in wood growth rings. Such trait differences exist not only between trees but also within individual tree stems where they occur along the length (top to bottom) as well as across the woody stem. Identifying subtle changes in a wood phenotype by experimentally altering gene expression is therefore difficult unless a very high number of individuals is tested, a problem which is enhanced by tree size and the age of trait manifestation.
One method that has been successfully used to overcome many of these problems is an approach called Induced Somatic Sector Analysis (ISSA). In this method the bark is peeled from a small area of the trunk and an upward bark flap is created to expose the vascular cambium (Figure 1a). Dozens of flaps can be created on a single stem.
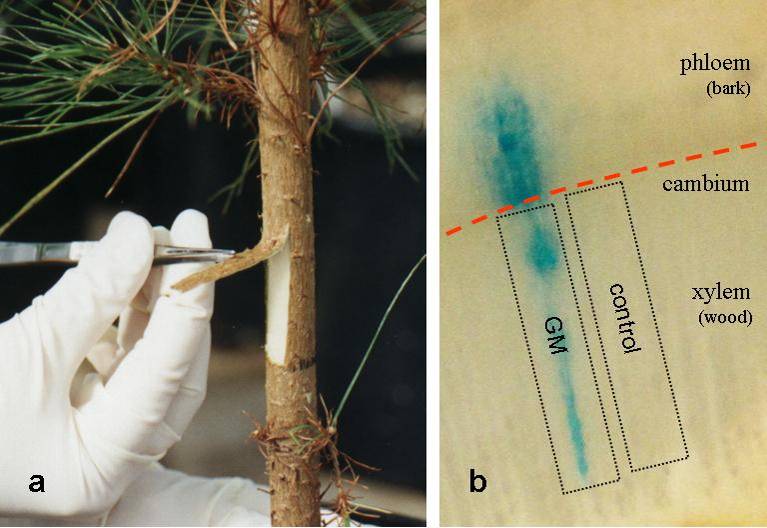
Figure 1 (a) Bark flap exposing the vascular cambium for application of the candidate gene in a suspension of Agrobacterium tumefaciens. (b) After 2-4 weeks, growth of transformed cambial initials leads to formation of somatic tissue sectors include newly formed wood and bark
A suspension of the soil bacterium Agrobacterium tumefaciens, the ‘workhorse’ for plant genetic manipulation studies, containing the gene of interest is then applied to the exposed cambium facilitating genetic transformation and leading either to over-expression or down-regulation of the target gene in individual cambial cells. The bark flap is returned back into place and, following an initial wound response, further growth of successfully transformed cambial initials will lead to the formation of somatic tissue sectors (from within the existing tissue). These sectors include both newly formed wood and bark which are genetically distinct from surrounding untransformed tissue (seen as a blue sector caused by the GUS construct in Figure 1b). Morphological and biochemical characteristics can thus be compared between individual sectors and directly neighbouring control tissue after only a relatively short period of time (2-4 weeks) and without concerns about variability that might have been caused by genetic background or diversity due to treatment or other environmental conditions.
The use of ISSA has been instrumental for example in determining the role of the \(\beta\)-tubulin gene in secondary fibre cell wall formation during wood formation in eucalypts. Secondary fibre cells are complex structures that collectively give rise to wood. Their walls largely consist of helically aligned cellulose microfibrils that are embedded in a matrix of lignin and hemicellulose and arranged in three distinct secondary cell wall layers (S1, S2 and S3) lying inside the primary wall of each fibre cell. The S2 layer is the dominant cell wall layer in this arrangement and the angle at which S2 cellulose microfibrils are aligned relative to the long axis of the cell is called the microfibril angle (MFA). MFA is an important ecological and economical trait as it determines the strength and flexibility of individual fibre cells and hence the woody tissue that is composed of these cells. A tree’s resistance to gales and structural utility as timber depend upon MFA. So, by creating and analysing the genetically modified wood sectors, scientists were able to demonstrate that the \(\beta\)-tubulin gene was involved in cellulose microfibril orientation in the S2 layer of secondary fibre cell walls. These experiments provided first clues about the genes and subsequent molecular events that enable trees to stay aloft. Biotechnology based on these genes and manipulation of MFA could thus be targeted by molecular editing.
Substantial tree bioinformatic resources such as the sequencing of complete poplar and eucalypt genomes are now providing unprecedented scope for gene manipulation, and unravelling of the process of wood formation. However, the elucidation of specific gene function during wood formation is likely to remain a task for ISSA and other similar transgenic approaches for the foreseeable future.
Spokevicius AV, Southerton S, MacMillan CP et al. (2007a) \(\beta\)-tubulin affects cellulose microfibril orientation in plant secondary fibre cell walls. Plant J 51: 717-726
Spokevicius AV, Tibbits J, Bossinger G (2007b) Whole plant and plant part transgenic approaches in the study of wood formation – benefits and limitations. Transgenic Plant J 1: 49-59
Van Beveren KS, Spokevicius AV, Tibbits J et al. (2006) Transformation of cambial tissue in vivo provides an efficient means for induced somatic sector analysis and gene testing in stems of woody plant species. Funct Plant Biol 33: 629-638
Xu T, Ma T, Hu Q, Liu J (2015) An integrated database of wood-formation related genes in plants. Scient Rep 5: 11422
Cell growth in plants occurs by division followed by expansion in special zones termed zones of division (meristems) or expansion or in trees, the cambium. “Growth” can be defined as the irreversible expansion of cell walls.
The process starts when cells divide in meristems and must expand before they can divide again, so expansion is often considered part of the division process. But the rapid part starts afterward in daughter cells from the division. If conditions are good, these cells can double in size every few hours and eventually become up to 100 or 1000 times larger than the original cells. This rapid enlargement is driven by osmotic forces as described below, but under strict developmental control.
In zones where expansion occurs, the cell wall is the controlling structure. It is tough and strong. Typically, osmosis creates turgor pressures (P) inside the cell, and the wall must be able to contain this pressure. Normally P is rather high, around 0.5 MPa or more or equivalent to two to three times the pressure in an automobile tyre. Cell wall yielding is a special property because it resists expansion sufficiently to maintain turgor pressure but yields sufficiently to allow cell expansion.
While the expansion occurs, new material is simultaneously synthesised and deposited in the wall. Maintaining wall thickness is essential because enlargement of 100- to 1000-fold would make the wall too thin to hold P. In most plant cells, the thickness remains the same within a factor of about two. Consequently, in the living cell, expansion and deposition go together in the wall. The cytoplasm also expands but most of the expansion is in the large central vacuole, and the cytoplasm ends up as a thin layer inside the wall. The plasma membrane and vacuole membrane expands, while the volume of the cytoplasmic organelles and their membranes most likely remains the same.
The direction of expansion is controlled by the alignment of cellulose microfibrils in transversely oriented bands (Figure 7.21). These permit extension to proceed only along the long axis of the cell. The cytoskeleton lying underneath the plasma membrane is a central player in co-ordination of wall shape and expansion in different dimensions (see Case Study 7.2 “The significance of cell walls”, Figure 3). The orientation of the arrays of microtubules determine the orientation of cellulose microfibrils in the wall.
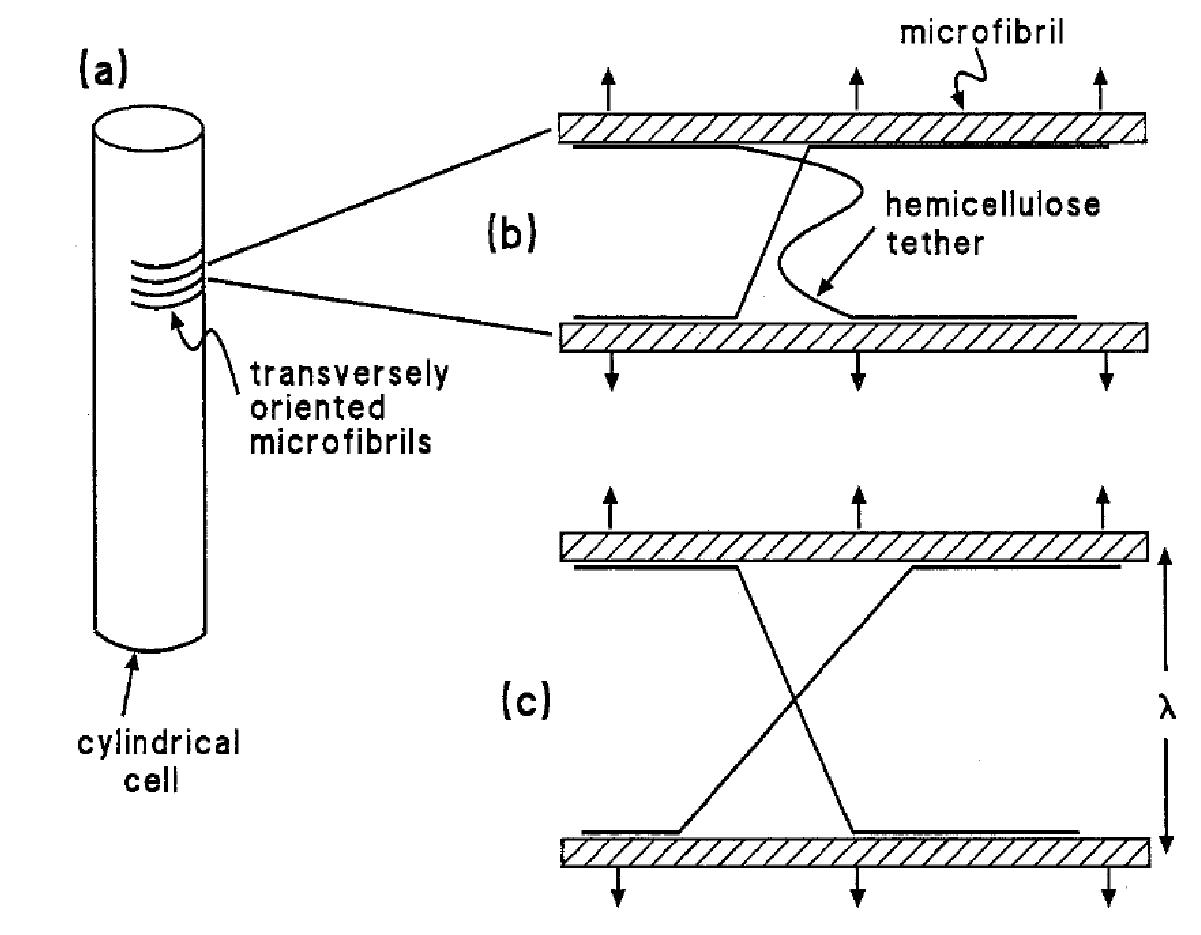
Figure 7.21 Schematic portrayal of the structure of an expanding cell wall. (a) A cylindrical cell, showing the transverse arrangement of cellulose microfibrils. (b) A pair of adjacent microfibrils connected by hemicellulose molecules (tethers) that are attached by hydrogen bonds; the arrows denote the force generated by turgor that is moving the microfibrils apart. One of the tethers, the straight one, is load-bearing; the other (wavy) is not. (c) The same microfibrils as in (b), whose separation in response to the applied force has resulted in a previously loose tether becoming load-bearing. (JB Passioura and SC Fry, Aust J Plant Physiol 19: 565-576, 1992)
The wall is an intricate network of polymers that, when capable of expanding, is termed the primary wall. The secondary wall is formed underneath the primary wall when it has finished expanding, and is thicker. The secondary wall is elastic and can shrink or swell but not expand irreversibly like the primary wall.
Primary walls are composed predominantly of a complex array of polysaccharides (~90%) and some protein (~10%). In all cell types, rigid cellulose microfibrils are embedded in a gel-like matrix of non-cellulosic polysaccharides and pectins. These polysaccharides are intimately associated with one another, both non-covalently and covalently, and often with proteins and lignins. Walls are complex, diverse and dynamic, changing throughout the processes of cell division, growth and differentiation. The types of wall polysaccharides vary depending on the plant species, cell type and developmental stage (Doblin et al. 2010). In some woody tissues, the secondary wall can be very thick and make up more than half the total volume of the cell.
Growing cells are surrounded by thin walls (100 nm or less) that are sufficiently flexible to yield to the hydrostatic forces that drive growth. The primary walls are highly hydrated (~60% of wet weight) and in dicots and gymnosperms consist of a cellulosic network embedded in a matrix of complex polysaccharides, of which xyloglucans and pectic polysaccharides are most abundant (Figure 7.22). Primary walls of most monocots are organised in essentially the same way except glucans and glucuronylarabinoxylans predominate in the matrix phase and may have properties similar to xyloglucans and pectins.
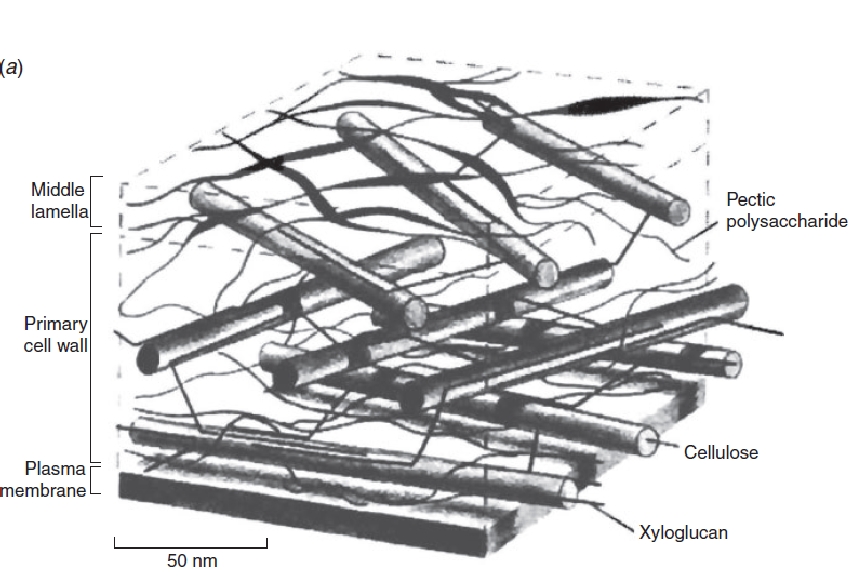
Figure 7.22 Structure and organisation of the primary cell wall. Simplified schematic, drawn-to-scale and showing the spatial arrangement of polymers in a pectin-rich primary cell wall. (MC McCann and K Roberts, In ‘The cytoskeletal basis of plant growth and form’ Academic Press, 1991)
The main wall constituent that allows the primary wall to expand is the gel-like matrix in which the cellulose microfibrils are embedded. Typically consisting of xyloglucans and pectins, attention is increasingly directed toward the pectins because mutant Arabidopsis plants (xxt1 and xxt2) still can grow even though they totally lack xyloglucans (Cavalier et al. 2008). On the other hand, the genes for pectins have proliferated during the evolution of land plants and Arabidopsis has 15 involved in the synthesis of linear pectins, and 10 more that resemble these genes. Some of their mutants are lethal, especially mutants in GAUT1 and GAUT4 that are the major ones coding for enzymes synthesising linear pectins (Caffal et al., 2009). This suggests a central role for the pectins in the wall. The cellulose does not contribute directly to the growth process and instead mostly strengthens the wall. As a polysaccharide consisting of a linear chain of several hundred to many thousands of β(1–4) linked D-glucose units, it spontaneously crystallises in cellulose microfibrils having about 20 cellulose chains assembled into long cables a few nanometers in diameter. These are cross-linked by hydrogen bonds to a matrix of hemicellulose and pectin along with a small amount of structural protein. The microfibrils have a high tensile strength approaching that of steel, and their orientation in the wall determines the shape of the expansion. When laid down in an orientation perpendicular to the long axis of the cell, lateral expansion is inhibited and the wall extends mostly lengthwise. The longitudinal extension stretches the matrix between the microfibrils, spreading the microfibrils apart. The orientation of the microfibrils thus controls cell shape while the matrix controls growth rate.
The secondary wall is laid down underneath the primary wall when it has finished expanding, that is, when the cell has stopped growing. The secondary wall is elastic, it can shrink or swell and undergo reversible but not irreversible expansion. In some woody tissues, the secondary wall can be quite thick and be over half the total volume of the cell.
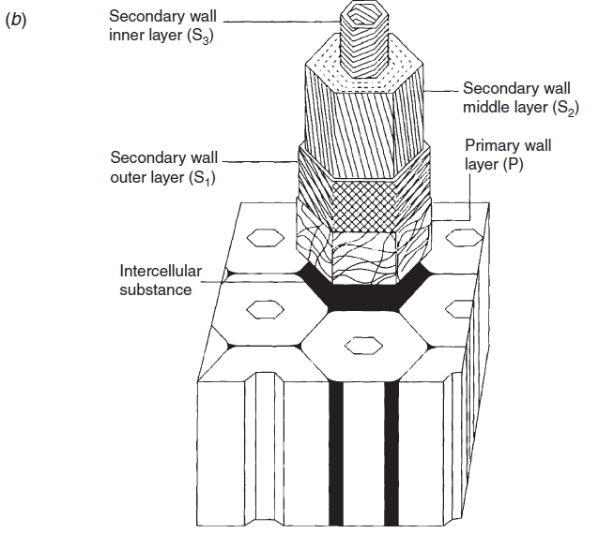
Figure 7.23 Schematic representation of the wall of a fully grown cell, showing the cellulose microfibril orientation in the primary (P) and secondary (S1, S2, S3) wall layers of a xylem fibre cell or a tracheid. (AB Wardrop and DE Bland, In ‘Biochemistry of Wood’ Pergamon Press, 1959)
Osmosis makes cell expansion possible. Osmotic concepts were first understood by J. Willard Gibbs (1875-76) and demonstrated experimentally soon thereafter by Wilhelm Pfeffer (1876). Neither of these scientists knew how the process caused growth but Pfeffer (1900) sensed that the critical feature was turgor pressure (P). It is now known that P has to be low enough to create a water potential to bring water into the growing cell while at the same time being high enough to expand the wall. This dual role can be understood from the theoretical basis of osmosis (Figure 7.24).
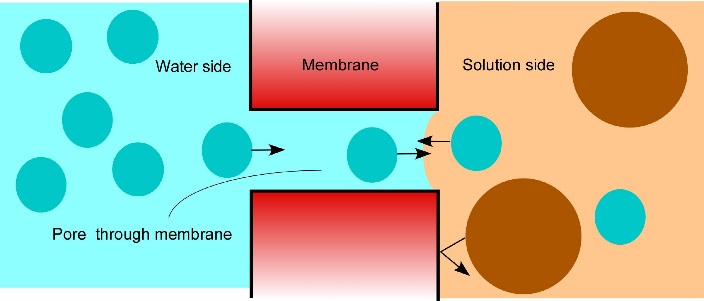
Figure 7.24 How osmosis works. Water is on the left shown as blue dots. An aqueous solution is on the right shown as a mix of blue dots and large brown dots (solute). A porous membrane separates the two compartments but the pores are too small or too selective for the solute to move through. Instead, the solute is reflected by the membrane. The water side contains more water than the solution side because the solute occupies space that otherwise would be occupied by water. Consequently, more water enters the pores from the water side than from the solution side. As long as there is a concentration difference on the two sides of the membrane, more water will cross from the diluter side than from the concentrated side. (Diagram courtesy JS Boyer)
Osmosis in a constrained compartment like a plant cell causes P to build up inside the cell until it becomes high enough to prevent net water entry. At that stage, the cell is in equilibrium with the solution in its surroundings. Inside the cell, P is the turgor pressure and it can be high (positive pressures of 0.5 MPa are common). Outside of the cell in the wall that is hydraulically connected to the xylem, P can vary considerably and tends to be negative during the day because the xylem water is under tension (negative pressure). The tension in xylem is of course transmitted throughout the apoplast. Bearing this in mind, it is possible to express mathematically the osmotic forces and flows across a membrane as:
\[ \frac{dV}{dt} = AL_{p}[(P_i - P_o) - (\Pi_i - \Pi_o)] \tag{1} \]
where V is the net volume of water moving osmotically across the membrane, \(t\) is the time, \(A\) is the area of the membrane, \(P\) is the pressure, \(\Pi\) is the osmotic effect of the solute concentration, \(L_{p}\) is the hydraulic conductivity of the membrane, and subscripts \(i\) and \(o\) refer to the interior (cytoplasm) and exterior (apoplast) of the cell.
It is important to point out that the water potential is \( \Psi = P – \Pi \) and Eq. 1 simplifies to:
\[ \frac{dV}{dt} = AL_{p} \Delta \Psi \tag{2} \]
where \( \Delta \Psi \) is the water potential difference between the inside and outside of the cell. At equilibrium, \(P\) builds until the net flux is zero and Eq. 1 becomes:
\[ (P_i - P_o) = (\Pi_i - \Pi_o) \tag{3} \]
Let’s see how Eq. 3 fits plant cells whose apoplast is hydraulically connected to the xylem. Starting in the xylem where the solution is very dilute (say \(\Pi_o\) = 0) and the wall solution is under tension (say \(P_o\) = -0.7 MPa), osmosis will move water into the cell as long as the cytoplasm is more concentrated (say \(\Pi_i\) = 1 MPa). As water moves in, \(P_i\) builds inside until it prevents water from entering. Ultimately, the \(P_i\) reaches 0.3 MPa whereupon the cell is equilibrated with its surroundings, as shown in Eq. 3 but expressed numerically in Eq. 4:
\[ 0.3 - (-0.7) = (1 - 0) \tag{4} \]
Notice in Eq. 4 that the P difference across the membrane equals the \(\Pi\) difference across the membrane. In other words, the pressure difference is in equilibrium with the osmotic effect of the solute. Of course, if insufficient water can enter the cell to build its turgor as high as 0.3 MPa, \(P_i\) decreases. If it falls near zero, we sometimes see the leaf “wilting”.
A major advantage of the water potential is that it describes the direction of water movement, taking osmotic properties and pressures into account in one symbol. According to the example above (Eq. 4), the water potential outside of the cell is -0.7 MPa (-0.7 + 0.0). Because outside and inside are in equilibrium, the water potential inside of the cell is also -0.7 MPa (0.3 - 1.0). In both places, \(\Psi\) is a negative number (like temperatures below zero).
Osmosis is the key to water entry into the plant. It not only causes water to enter the cells of the plant but also creates the tension in the xylem transmitted to the cell wall (apoplast) that pulls water through the root from the soil. In fact, this ability to pull water from the soil has to balance transpiration. In other words, water uptake by osmosis is necessary to prevent the plant from drying out. Larger \(\Delta\Pi\) create the potential for greater pull extending out into the soil. Wheat typically contains large \(\Pi_i\) (2.0 to 2.5 MPa) that allows it to obtain water from relatively dry soil. Maize generally has small \(\Pi_i\) (1.2 to 1.8 MPa) that makes it less able to obtain water from dry soil. Maize tends to be less drought tolerant than wheat. The reasons for the \(\Pi_i\) differences are unknown.
These ideas work for osmosis in plant cells that discriminate perfectly between solute and water (water moves through the membrane but solute does not). In healthy cells, most membranes are nearly perfect and negligible solute moves through (solute actually moves through on specific carriers but the amount is negligible osmotically). If solute crosses the membrane, it acts essentially the same as a water molecule, and the osmotic force Π is diminished. Places where this may happen are phloem termini where large amounts of solute are delivered to the developing embryo along with water. Developing grain would be an example. Another place is in air-dry seeds whose membranes have been dehydrated and are leaky to solute until the cells are rehydrated during imbibition, allowing the membranes to re-form.
So far, we have only considered the hydraulic conductivity of membranes of individual cells. Sometimes it might be useful to determine the conductivity of a whole organ such as a root system or leaf. For that an abbreviated form of Eq. 1 is typically used:
\[ \frac{dV}{dt} = L(\Delta\Psi) \tag{5} \]
where \(L\) is called the water conductance of the organ and the definition of the other terms remains unchanged. The reason we cannot use Eq. 2 is that the area for flow is not the plasma membrane of the cell. In effect, \(A\) is undefined and is included in \(L\) but the general principle governing flow is otherwise like that in Eq. 2. As you can see, the bigger the root system the higher the flow and thus \(L\) will tend to get larger as the organ grows.
Plants grow mostly by increasing the size of cells in enlarging regions. For a cell to become larger, the wall becomes irreversibly extended by \(P\). In effect, the wall in a growing cell is constructed so the polymers slip a little at high \(P\). In that situation, as \(P\) builds from osmosis, it never reaches a level where equilibration can occur. Instead, \(P\) can only build enough to cause irreversible slippage (yielding) of the wall and the wall compartment becomes bigger. This can be demonstrated by lowering \(P\). Even if \(P\) decreases as low as zero, the compartment remains bigger than it was.
Typically the \(P\) must be higher than a minimum before yielding occurs. It is possible to express this wall property with an equation similar to Eq. 2. Lockhart (1965) was the first to do so and described cell enlargement for \(P\)-driven growth as:
\[\frac{dV}{dt} = A \phi (P - P_{th}) \tag{6} \]
where \(\phi\) is the wall yielding coefficient, sometimes referred to as wall extensibility (m Pa–1 s–1) and \(P_{th}\) is threshold turgor pressure or yield threshold (\(P_{th}\)) above which the cell wall yields. The other terms are defined as before. It is obvious in Eq. 6 that \(P\) must be above \(P_{th}\) in order for the cell to enlarge. Also, as \(\phi\) becomes larger, the cell grows faster.
In tissues instead of individual cells, a similar equation applies because all the cells enlarge in concert. The enlargement of the whole organ is then described by:
\[\frac{dV}{dt} = m (P - P_{th}) \tag{7} \]
where everything is the same as in Eq. 6 except that \(m\) contains the wall yielding attributes for all the enlarging cells as well as the \(A\) term. Examples where this equation applies would be tissues of enlarging stem and root tips, hypocotyls and coleoptiles of geminating seeds, flower buds, and even growing fruits (grapes, tomatoes, maize kernels, etc).
Nevertheless, the inability of \(P\) to build enough for equilibration keeps the cell water potential lower than it otherwise would be. As a result the yielding walls create a lower water potential that is called “growth-induced” because mature cells that do not have such yielding walls (Figure 7.25). The growth-induced \(\Psi\) can move water from the mature cells into the elongating ones if no external supply is available. This probably explains how a stored potato can sprout in a cupboard because the cells in the bud develop yielding walls that create a growth-induced \(\Psi\) that moves water from the mature cells into the sprouts.
Usually the water source is in the soil or xylem (\(\Psi_o\)), and a slight modification to Eq. 5 can show this effect:
\[\frac{dV}{dt} = L (\Psi_o - \Psi_{growth-induced}) \tag{8} \]
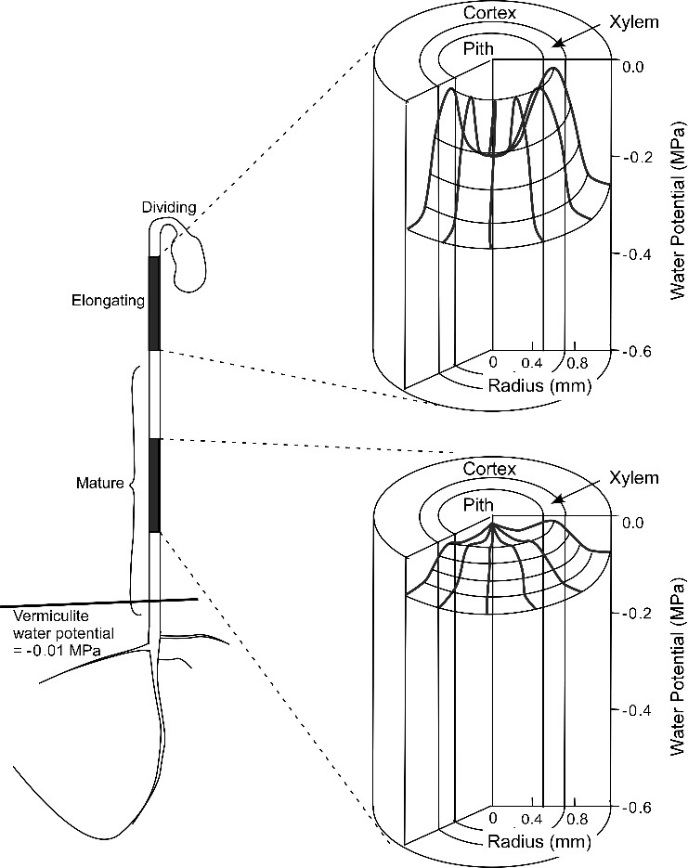
Figure 7.25 Water potential fields (three dimensions) in two regions of soybean hypocotyls growing at about 1.5 mm h-1. Fields show highest water potential in the xylem and lowest in the pith and cortex. Steepest field was in the elongating tissues and is growth-induced because the yielding walls in the elongating cells prevented \(P\) from become as high as in mature cells. The steeper field allows the growing region to extract water from the mature region when other water sources are not available. Fields were directly measured in the same intact plant while transpiration was prevented, using a microcapillary of a pressure probe. (Redrawn from H Nonami and JS Boyer, Plant Physiol 102: 13-19, 1993).
Because the cells with yielding walls have turgor that is \(P = \Pi + \Psi_{growth-induced}\) (remember \(\Psi\) is negative), Eq. 7 becomes:
\[\frac{dV}{dt} = m (\Pi + \Psi_{growth-induced} - P_{th}) \tag{9} \]
and solving for \(\Psi_{growth-induced}\) in Eqs 8 and 9 gives:
\[\frac{dV}{dt} = \frac{mL}{m + L} (\Psi_o + \Pi - P_{th}) \tag{10} \]
This shows that growth depends on a water supply function (Eq. 8) and a water demand function (Eq. 7) that can be combined to give Eq. 10. A quick look at this latter expression shows that the growth rate of an organ is determined by the water potential of the supply, the osmotic effect of the solute minus the threshold turgor (which is too low to contribute to the growth rate) multiplied by a coefficient. In other words, the difference in water potential that we’ve seen before in Eq. 5 diminished by the threshold turgor that is inactive in the growth process provides the driving force for growth. When multiplied by the coefficient, \(\frac{mL}{m + L}\), the equation gives the growth rate of the organ.
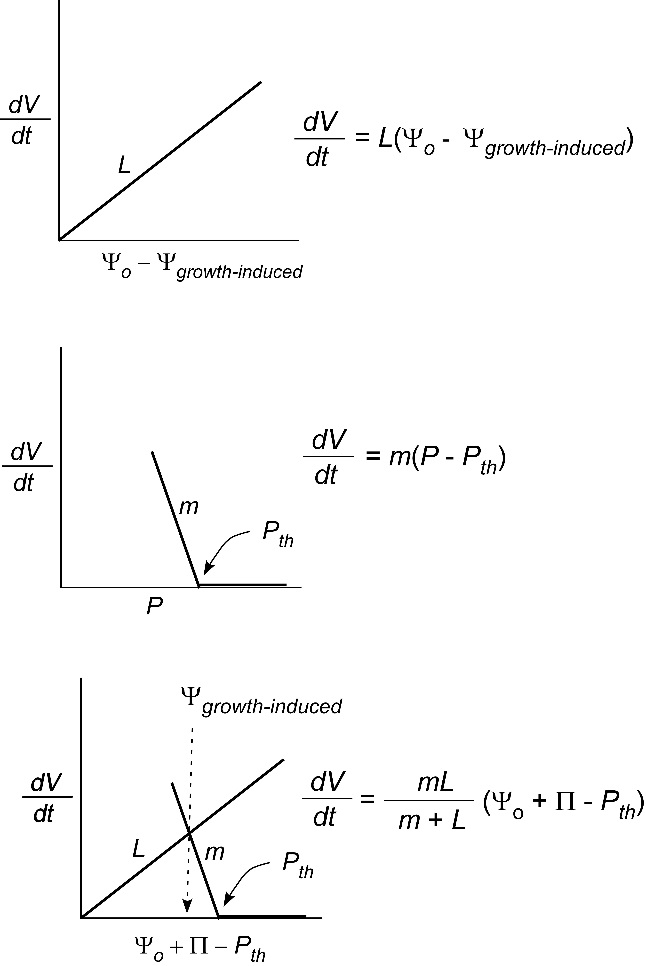
Figure 7.26 Diagram of the steady growth of a plant organ. Water uptake for growth (\(dV/dt\)) is a simple linear function of the conductance (\(L\)) between the water supply (\(\Psi_o\), usually the vascular system) and the average water potential (\(\Psi_{growth-induced}\)) of all the expanding cells in the organ (top of diagram, Eq. 7). In the same organ, the cells have walls that can slip a little (\(m\)) when turgor (\(P\)) is above a threshold (\(P_{th}\)) (middle, Eq. 8). Combining the two relations defines the \(\Psi_{growth-induced}\) and \(P\) for the organ (Eq. 10, bottom). Notice that the \(\Psi_{growth-induced}\) is always lower than the (\(\Psi_o\). Furthermore, the position of \(\Psi_{growth-induced}\) is determined by \(L\) and \(m\). (Diagram courtesy JS Boyer)
It is worth looking at the coefficient a little more deeply. If the wall yields easily and m is large (say \(m\) = 10 units and \(L\) = 1 unit), the coefficient is 10/11 and the growth rate is controlled mostly by the ability of water to move into the enlarging tissues. If the reverse occurs (\(m\) = 1, \(L\) = 10), the coefficient is still 10/11 but the growth rate is controlled mostly by the yielding properties of the walls. Therefore, comparing the magnitude of \(m\) and \(L\) is the key to determining whether the demand (\(m\)) or the supply (\(L\)) function dominates the coefficient. A picture of these effects is shown in Figure 7.26 and methods are available for measuring not only \(m\) and \(L\) but also all the other terms in these equations (Boyer et al., 1985).
It is pretty obvious from this behaviour that simply putting water around a tissue creates a system with several interacting factors. The growth rate could be affected not only by \(P\) but also by \(m\), \(L\), \(\Pi\), or \(P_{th}\). In an effort to simplify this system, scientists have sought single cells that could be surrounded by water. From a practical point of view this allows \(P\) and \(m\) to be the main factors controlling growth and minimises the effect of \(L\), as shown in Figure 7.27.
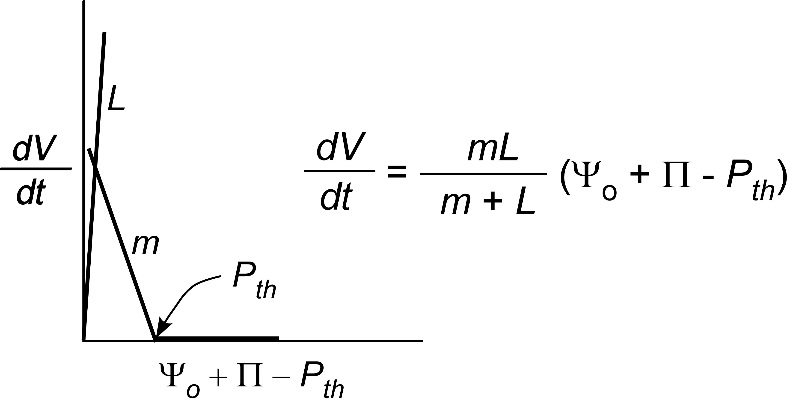
Figure 7.27 Simplified version of Fig. 5 for a single cell surrounded by water (\(\Psi_o = 0\)). \(L\) is so large that \(P\) and \(m\) control the growth rate if \(\Pi\) and \(P_{th}\) are constant. (Diagram courtesy JS Boyer)
One approach has been to use single algal cells large enough to measure \(P\) and growth (\(\frac{dV}{dt}\)) simultaneously. Chara corallina or Nitella flexilis are candidates because they have cells large enough for the measurements. They are naturally surrounded by fresh or brackish water and have rhizoids resembling roots. Gametes form in structures in the axils of branches analogous to flowers or cones in their land counterparts. In fact, genomic and morphological analyses consider these algae to be among the closest relatives of the progenitors of land plants. In the internode cells of Chara or Nitella, microfibrils are oriented normal to the cell axis and the walls expand mostly in length like many plant tissues (roots, stems, grass leaves).
Using the internodes of these species, \(P\) and growth rate (\(\frac{dV}{dt}\)) can be monitored simultaneously and changed so quickly that \(\Pi\) and \(P_{th}\) remain constant. This allows the \(P\) response to be rigorously determined. Moreover, the walls can be isolated without leaving the medium in which the algae are grown. The same measurements can be repeated without the cytoplasm. This is a great tool for observing the response to \(P\). When the growth of the live cells was compared with that in the isolated walls, they were similar but only for the first hour or so. After that, growth ceased in the walls but continued in the live cells even though the walls and cells had the same \(P\). Something was missing in the isolated wall that was being supplied by the live cells.
Considering that new wall material is supplied by the cytoplasm and missing in the isolated walls, if seemed reasonable to supply new wall constituents as though the cytoplasm had done so. Supplying pectin (a wall polymer) to the growth medium returned the growth rate of isolated walls to the rate in the live cells! This was unexpected but indicated the wall needed a supply of pectin in order to continue growing. The active pectin was a linear unbranched polymer of α-1,4-D-galacturonic acid sometimes with a small amount of rhamnose (usually 1-2%) that is normally synthesised in the cytoplasm and released to the wall by exocytosis. It becomes a prominent member of the wall matrix and forms a gel embedding the cellulose microfibrils.
The pectin gels because calcium ions bind to neighbouring pectin polymers. The cross-bridging forms junction zones with the polymers that are strong enough for the pectin to form a gel solid. The gel gets stronger with more cross-bridges. The new pectin from the cytoplasm removed some of the cross-bridges from the wall, weakening the wall gel and allowing the polymers to slip a little. This action occurred only when \(P\) was above \(P_{th}\), and only when temperatures were warm enough for growth. Figure 7.28 compares the turgor pressure and temperature responses of the live algal cells with those of land plants tissues.
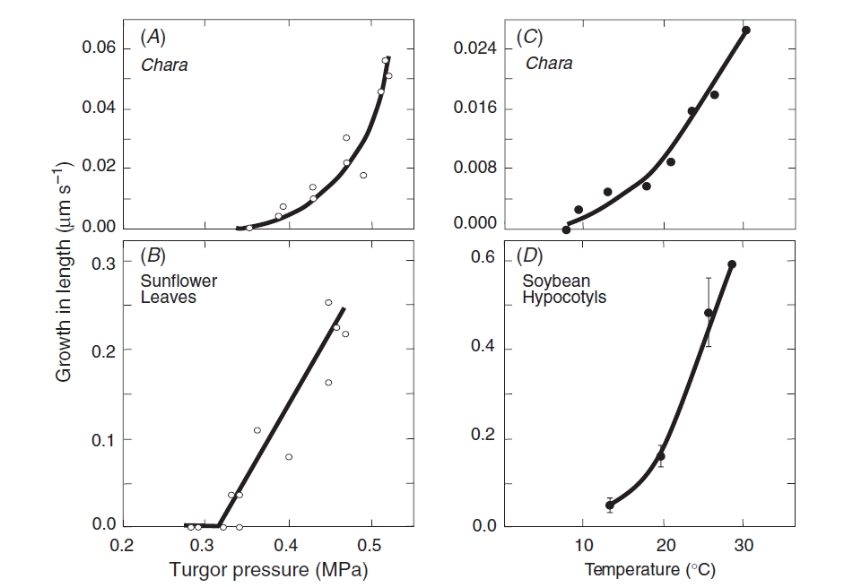
Figure 7.28 Turgor pressure and temperature responses of single algal cells compared to land plant tissues. Turgor pressure and growth in (A) Chara internode cell and (B) sunflower (Helianthus annuus) leaves at 25 °C. Temperature and growth in (C) Chara internode cell and (D) soybean hypocotyls at turgor pressure of 0.4 to 0.5 MPa. (JS Boyer, Funct Plant Biol 36: 385-394)
A chemical mechanism has been proposed to account for this behaviour and is called a “calcium pectate cycle” (Figure 7.29). It seems possible that the chemistry might also occur in land plants. As long as pectin, calcium, and sufficient turgor pressure are present, the cycle should occur in pectin-containing walls. Pectins are among the most conserved components of cell walls during plant evolution, and the similarity in pressure and temperature response in these algae and land plants suggests a common mechanism in both. However, despite these intriguing similarities, definitive tests remain for the future.
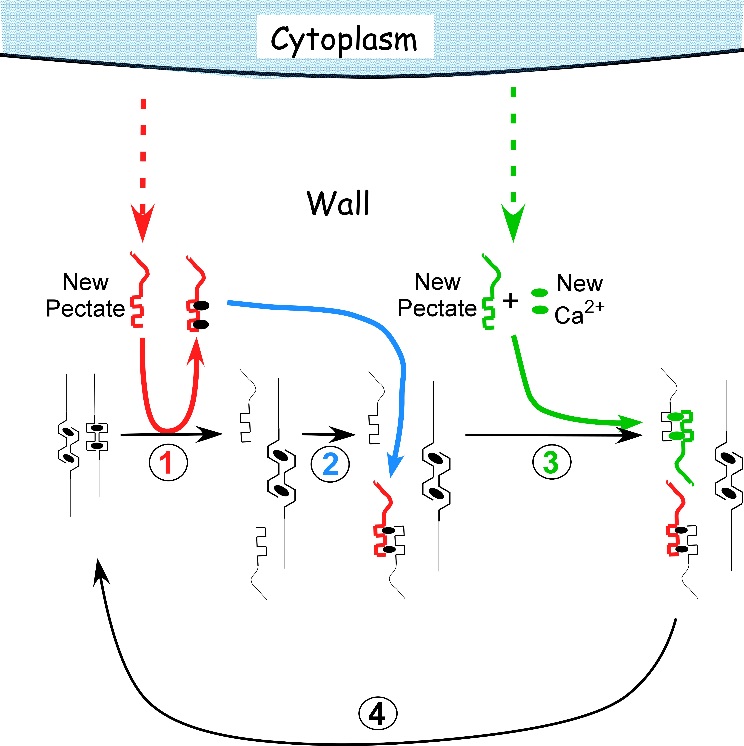
Figure 7.29 Proposed mechanism of cell enlargement in Chara. The diagram shows the calcium pectate cycle occurring in the cell wall for two calcium pectate cross-bridges (black ovals in anti-parallel pectate molecules, left side of figure). Turgor pressure is high enough to distort the egg-box in one of the pair, weakening its bonds with calcium (left pectate in pair). New pectate from the cytoplasm (dashed red arrow) is undistorted and preferentially removes calcium from the weakened and distorted pectate (step 1, red). The load-bearing pectate relaxes after its cross-bridging calcium is removed. The wall elongates incrementally, shifting the load to the other member of the pectate pair, which distorts. The remaining steps 2 to 4 follow by depositing calcium pectate (step 2, blue) and new calcium from the medium plus new pectate from the cytoplasm (step 3, green), resulting in a cycle (step 4, black). The net result is elongation plus wall deposition. Although shown for only two cross-bridged pectate molecules, the same principles apply to larger numbers of cross-bridges. Note that in Chara the cycle occurs in the medium in which the cells are grown (0.6 mM Ca2+). Also note that the rate of growth depends on the rate of pectate release from cytoplasm to wall by exocytosis (red and green dashed arrows). Each step in the diagram was demonstrated experimentally in Chara. (JS Boyer, Front Plant Sci 7:866, 2016)
In other experiments a class of cell wall proteins, expansins, are proposed as potential agents for catalysing yielding in vivo (McQueen-Mason 1995). Figure 7.30 shows sharp gradients in growth along the hook of a cucumber hypocotyl that are paralleled by a gradient in extension of these tissues when stretched under acid conditions (Figure 7.30b) but not at neutral pH (Figure 7.30c). When tissues were killed by boiling, extension was blocked (Figure 7.30d). From these results, it seems that hypocotyl extension requires acid pH and non-denatured proteins. However, all the experiments were done in an extensometer with a uni-axial pull substantially less than the multi-axial tension exerted by \(P\). Since growth requires \(P\) above a threshold in order for walls to yield (Eq. 7), it is difficult to interpret this proposal. When greater uni-axial pull was used by Ezaki et al. (2005) to study hypocotyl growth in soybean hypocotyls, pectin chemistry appeared to determine growth rate. In fact, Zhao et al. (2008) give evidence that pectins may be the target of expansin action.
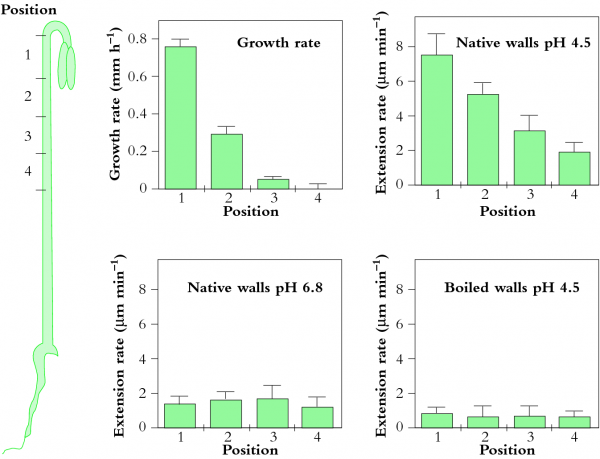
Figure 7.30 Distribution of growth and wall extension at four positions along a cucumber hypocotyl. (a) Growth rate is most rapid near the hook. (b) Hypocotyl segments were frozen, thawed, abraded and stretched under a 20 g load in an acidic buffer (pH 4.5), which is much less tension than exerted by \(P\). Most rapid extension occurred in the fast-growing hook. (c) When measured at pH 6.8, segments extended very little. (d) Segments in which enzymes were denatured by boiling did not extend under the load. (SJ McQueen-Mason, J Exp Bot 46: 1639-1650, 1995)
Notice that the growth mechanism in Figure 7.29 is entirely chemical, with no role for enzymes. It is difficult to hypothesize an enzymatic mechanism because of the requirement for \(P\) above a threshold. Enzyme activity is generally unaffected by these pressures and would continue acting regardless of \(P\). What is clear is that the biophysical consequences of instantaneous changes in \(P\) will be followed by a phalanx of biochemical events including wall polymer synthesis and altered gene expression, and rigorous methods will be required to distinguish enzymatic from biophysical hypotheses. For instance, sustained expansion of plant cell walls cannot be explained simply by inexorable wall hydrolysis; if it were, cell walls would weaken to breaking point during growth. The ‘setting’ of long-term cell expansion rates is likely to hinge on biochemical and chemical events underlying wall relaxation and reinforcement.
Molecular events leading to cessation of wall expansion are even less well understood than those which initiate growth. For example, part of the growing region stops growing when water deficits occur around maize roots (Figure 7.31).
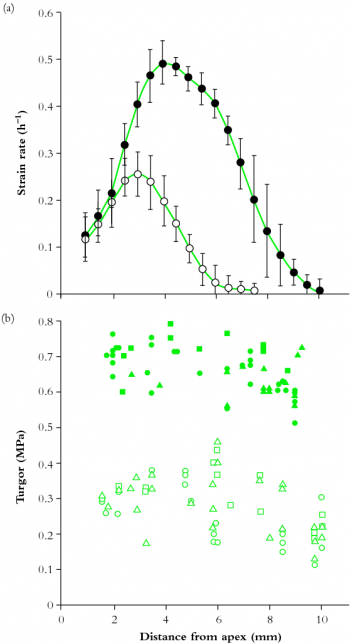
Figure 7.31 Spatial distribution of (a) elongation rates and (b) turgor pressures along apical zones of maize roots grown either in hydrated (Ψ = -0.02 MPa; filled circles) or rather dry (\(\Psi\) = -1.6 MPa; open circles) vermiculite. Note that water deficit only depressed growth at positions more than 2 mm from the apex but \(P\) was lower at all positions in water deficient roots. (WG Spollen and RE Sharp, Plant Physiol 19: 565-576, 1991)
Clearly, the region farthest from the tip has stopped growing but \(P\) remains uniform throughout the zone. \(P\) is lower in the water deficient roots presumably because less water can be absorbed from the water deficient soil. A common view is that sufficient cross-linking develops to limit the extension of the matrix around cellulose microfibrils and prevent further wall expansion. Essentially, when a cell has reached its final dimensions its wall is ‘locked’ into a final, hardened conformation. From the description above, molecules with a specific role in growth cessation are thought to be exocytosed into cell walls, providing either substrates for cross-linkage reactions or enzymes catalysing cross-linkage of pre-existing wall polymers. Identification of cross-linkage reactions have led to a search for their presence in vivo. For example, ferulic acid residues in grass cell walls can cross-link to produce di-ferulic acid and potentially stiffen walls through formation of a polysaccharide-lignin network. Unfortunately, in rice coleoptiles the abundance of the di-ferulic form bore no relation to growth cessation. Also this form of stiffening might be difficult to distinguish from secondary wall deposition.
Secondary cell walls generally form after primary walls have ceased to grow but the familiar rigidity of secondary cell walls (e.g. wood) is mostly viewed as distinct from stiffening of primary walls. Lignification of primary walls commences earlier than once thought and is a possible factor in growth cessation (Müsel et al. 1997). Such a response might be controlled through release of peroxide into walls in much the same way as seen in walls subject to fungal attack. Peroxidase enzymes are candidates for the catalysis of these reactions. Understanding rigidification of this complex matrix of polymers demands input from the disciplines of biology, chemistry and physics. Combining established techniques with novel approaches to the study of individual cells (e.g. Fourier-Transform Infra-red microspectroscopy and the cell pressure probe) will bring new insights to the molecular basis of wall expansion.
Barlow PW (1973) Mitotic cycles in root meristems. In ‘The cell cycle in development and differentiation’ (Eds M Balls, FS Billet) pp. 113-165. (Cambridge University Press)
Boyer JS (1985).Water transport. Ann Rev Plant Physiol 36: 473–516
Boyer JS (2009) Cell wall biosynthesis and the molecular mechanism of plant enlargement. Funct Plant Biol 36: 383–394
Boyer JS (2016) Enzyme-less growth in Chara and terrestrial plants. Front Plant Sci 7: 866
Boyer JS, Cavalieri AJ, Schulze E-D (1985) Control of the rate of cell enlargement: Excision, wall relaxation, and growth-induced water potentials. Planta 165: 527-543
Caffall KH, Pattahil S, Phillips SE et al. (2009) Arabidopsis thaliana T-DNA mutants implicate GAUT genes in the biosynthesis of pectin and xylan in cell walls and seed testa. Mol Plant 2: 1000-1014
Cavalier DM, Lerouxel O, Neumetzler L et al. (2008) Disrupting two Arabidopsis thaliana xylosyltransferase genes results in plants deficient in xyloglucan, a major primary cell wall component. Plant Cell 20: 1519-1537
Clowes FAL (1959) Root apical meristems. Biol Rev 34: 501-528
Doblin MS, Pettolino F, Bacic A (2010) Plant cell walls: the skeleton of the plant world. Funct Plant Biol 37: 357-381
Ezaki N, Kido N, Takahashi K, Katou K (2005) The role of wall Ca2+ in the regulation of wall extensibility during the acid-induced extension of soybean hypocotyl cell walls. Plant Cell Physiol 46: 1831–1838
Huala E, Sussex IM (1993) Determination and cell interactions in reproductive meristems. Plant Cell 5: 1150-1165
Jensen WA, Kavaljian LG (1958) An analysis of cell morphology and periodicity of division in the root tip of Allium cepa. Amer J Bot 45: 365-372
McCann MC, Roberts K (1991) Architecture of the primary cell wall. In ‘The cytoskeletal basis of plant growth and form’ (Ed CW Lloyd) pp. 109–129. (Academic Press: London)
McQueen-Mason SJ (1995) Expansins and cell wall expansion. J Exp Bot 46:1639-1650
Meeks-Wagner DR (1993) Gene expression in the early floral meristems. Plant Cell 5: 1167-1174
Müsel G, Schindler T, Bergeld R, Ruel K et al. (1997) Structure and distribution of lignin in primary and secondary cell walls of maize coleoptiles analyzed by chemical and immunological probes. Planta 201: 146-159
Nonami H, Boyer JS (1993) Direct demonstration of a growth-induced water potential gradient. Plant Physiol 102: 13-19
Passioura JB, Fry SC (1992) Turgor and cell expansion: beyond the Lockhart Equation. Aust J Plant Physiol 19: 565–576
Spollen WG, Sharp RE (1991) Spatial distribution of turgor and root growth at low water potentials. Plant Physiol 96: 438-443
Waisel Y, Eshel A, Katkafi U (eds) (1996) Plant roots: The hidden half. 2nd edition, Marcel Dekker, New York.
Wardrop AB, Bland DE (1959) The process of lignification in woody plants. In ‘Biochemistry of wood’ (Eds K Kratzel, G Billek) pp. 92–116. (Pergamon Press: London)
Williams RF (1974) The shoot apex and leaf growth. Cambridge University Press.
Yadegari R, de Paiva GR et al. (1994) Cell differentiation and morphogenesis are uncoupled in Arabidopsis raspberry embryos. Plant Cell 6: 1713-1729
Zhao Q, Yuan S, Wang X et al. (2008) Restoration of mature etiolated cucumber hypocotyl cell wall susceptibility to expansin by pretreatment with fungal pectinases and EGTA in vitro. Plant Physiol 147: 1874-1885